당사 팬 페이지에 가입하십시오
- 조회수:
- 42040
- 평가:
- 게시됨:
- 2020.11.27 16:58
- 업데이트됨:
- 2020.11.27 19:06
-
 이 코드를 기반으로 한 로봇이나 지표가 필요하신가요? 프리랜스로 주문하세요
프리랜스로 이동
이 코드를 기반으로 한 로봇이나 지표가 필요하신가요? 프리랜스로 주문하세요
프리랜스로 이동
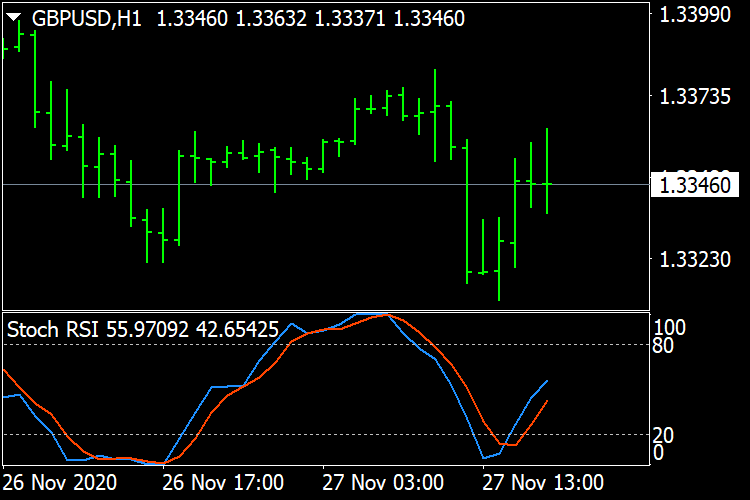
The Stochastic RSI indicator (Stoch RSI) is essentially an indicator of an indicator. It is used in technical analysis to provide a stochastic calculation to the RSI indicator. This means that it is a measure of RSI relative to its own high/low range over a user defined period of time. The Stochastic RSI is an oscillator that calculates a value between 0 and 1 which is then plotted as a line. This indicator is primarily used for identifying overbought and oversold conditions.
 Fibonacci Potential Entry - MT4
The 8 effective steps to build a robust day trading plan using Fibonacci retracement
 Doulble MA Cross Draw Histogram
Use the intersection of two moving average lines to draw a vertical line
Identify potential Trends/Range (Pivot Points) - MT4
This script was developed in order to help us detect if a chart is actually trending or going nowhere.
AverageRangeLines_v1.6
ADR,AWR,AMR,Draws Average Range Lines