당사 팬 페이지에 가입하십시오
- 조회수:
- 18929
- 평가:
- 게시됨:
- 2020.11.03 14:33
-
 이 코드를 기반으로 한 로봇이나 지표가 필요하신가요? 프리랜스로 주문하세요
프리랜스로 이동
이 코드를 기반으로 한 로봇이나 지표가 필요하신가요? 프리랜스로 주문하세요
프리랜스로 이동
The cause to make this :
When almost all the descriptions of some indicator are something like this :
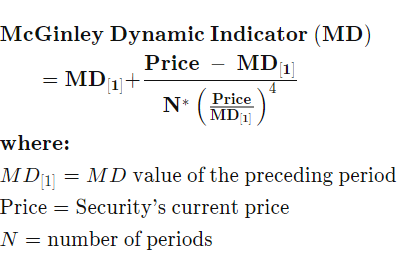
then one starts to wonder what is in that indicator that makes it so "good". There is a significant confusion at how the available versions are calculated, and it seems, that as far as metatrader is concerned, the formula used is almost always the wrong formula. This version uses the original formula and one "improved" formula.The McGinley Dynamic indicator is a type of moving average that was designed to track the market better than existing moving average indicators. It is a technical indicator that improves upon moving average lines by adjusting for shifts in market speed....
and so on ...
The original version is, without going into too much details, regardless of the bombshell descriptions, "slower" than usual averages (ie: lagging more than the averages it is usually compared to - like EMA or SMA). One might argue that it is done intentionally (to follow the "trend") but that we shall leave to others. The fact is that in the meantime one "improved" formula has appeared that obviously had an intention to make the indicator values closer to the compared ones, and it makes close to EMA. This version can calculate both the original formula and the "improved" version. The original formula is :
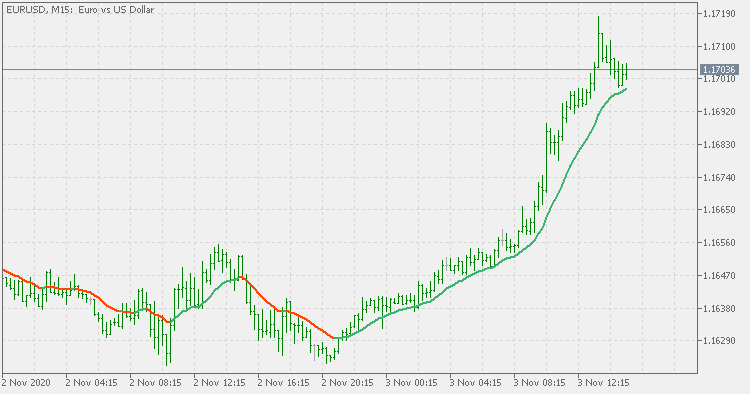
Comparison of the original formula to EMA and SMA (the gray lines)
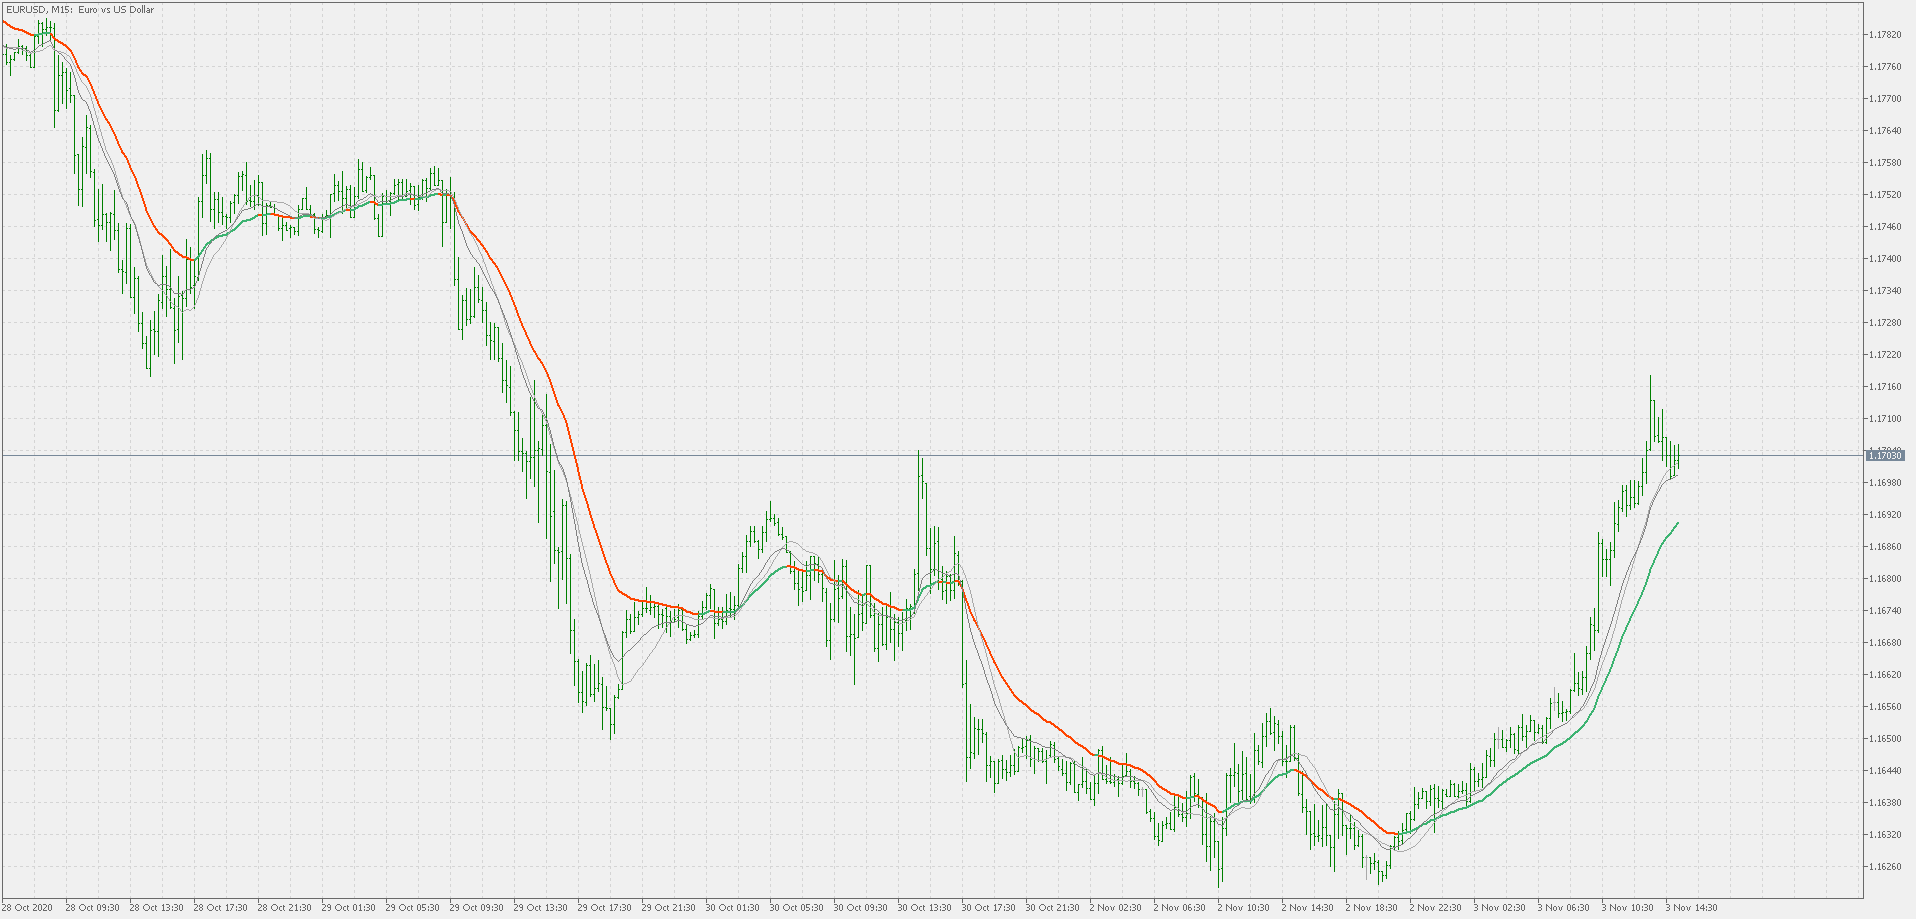
Comparison of the "improved" formula compared to those same EMA and SMA
Usage :
Use it as any other average indicator applied to prices
Important :
From the original formula it is obvious that the indicator has a fatal flaw : if there are 0 values in the series that it is applied to, then the indicator fails to produce meaningful result. If should be used only on data that never has 0 values
 Minimum / maximum support resistance zones
Minimum / maximum support resistance zones
 The best TIMES & DAYS our Strategy Works the best (Improve your Strategy) - MT5
For day traders. 2 highly important indicators to turn strategies into extreme winning ones. The Win/Loss ratio and the Reward/Risk ratio will allow us to identify the best times and days our strategy works the best
 Memento - behavioral design pattern
without violating encapsulation, capture and externalize an object's internal state so that the object can be restored to this state later
SSL Channel Chart
Trend indicator