당사 팬 페이지에 가입하십시오
- 조회수:
- 29734
- 평가:
- 게시됨:
- 2020.06.18 18:10
- 업데이트됨:
- 2020.11.12 22:38
-
이 코드를 기반으로 한 로봇이나 지표가 필요하신가요? 프리랜스로 주문하세요 프리랜스로 이동
Volatility Scanner
in very raw form for number of currency pairs.
Descritpion:
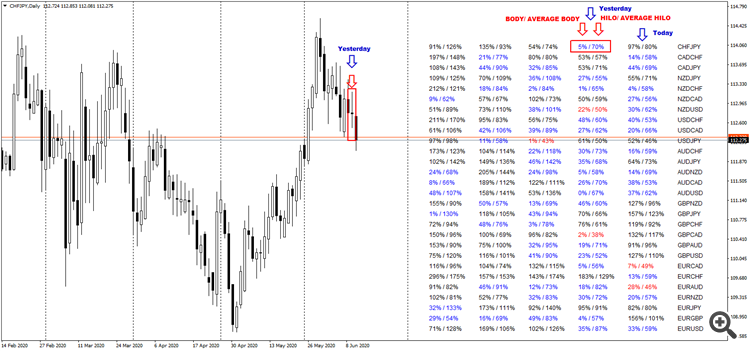
Indicator shows volatility starting from actual candle on the right side (next to the symbol) to older candles left from actual.
There are 2 numbers for each candle.
Left number is body size/ average body size calculated of 100 previous candles.
Right number is high-low size/ average high-low size calculated of 100 previous candles.
Lower volatility is marked with color.
Blue color means that body size is lower than 50% of average body and at the same time the high-low size is bigger than 50% of average high-low size.
Red color means that body size is lower than 50% of average body and at the same time the high-low size is lower than 50% of average high-low size.
You can change number of candles shown and size of the text.
Usage:
Can indicate uncertainty or possible swing points (doji bar) .
 PivotPointsLines _v1.1
Draws Pivot Points Level Lines for formula's Floor,Fibonacci,Camarilla,Woodie
 Bar Time Count Down
This MT4 indicator is to count down the remaining time as the format HH:MM:SS
 Consecutive Identical Candles
for number of currency pairs.
 Pan PrizMA CD Phase Sin leverage 72
Calculates the phase and amplitude of the expected wave.
