당사 팬 페이지에 가입하십시오

- 조회수:
- 9217
- 평가:
- 게시됨:
- 2019.04.10 21:49
- 업데이트됨:
- 2019.06.09 08:27
-
 이 코드를 기반으로 한 로봇이나 지표가 필요하신가요? 프리랜스로 주문하세요
프리랜스로 이동
이 코드를 기반으로 한 로봇이나 지표가 필요하신가요? 프리랜스로 주문하세요
프리랜스로 이동
Description:
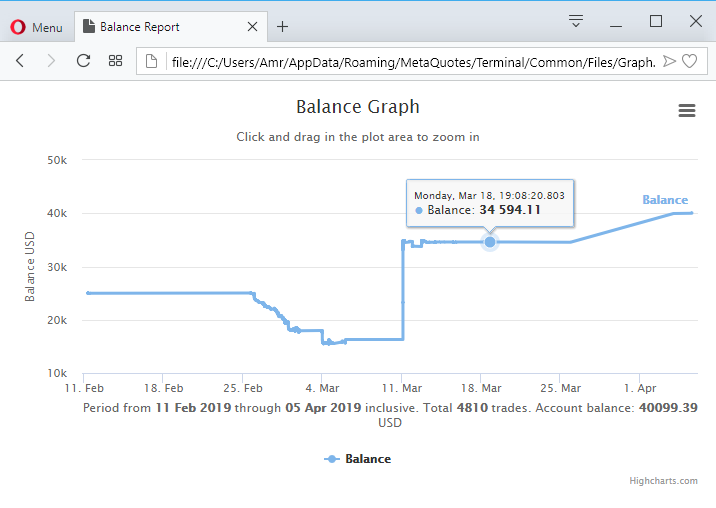
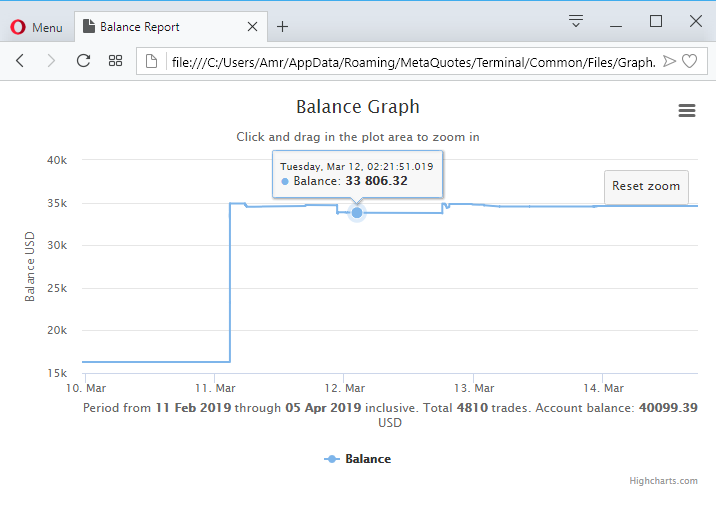
Display interactive HTML graph of the account balance inside the web browser.
The included template html file uses the HighCharts JavaScript library from https://www.highcharts.com/
Highcharts makes it easy for developers to set up interactive charts in their web pages.
Make your data come alive
How to use:
- Copy the files to the \Scripts folder
- Compile and run the script
- The web page should be displayed in your web browser.
The generated html file can be located at "%userprofile%\AppData\Roaming\MetaQuotes\Terminal\Common\Files\Graph.htm"
Tooltips showing the balance
Zoom at specific points
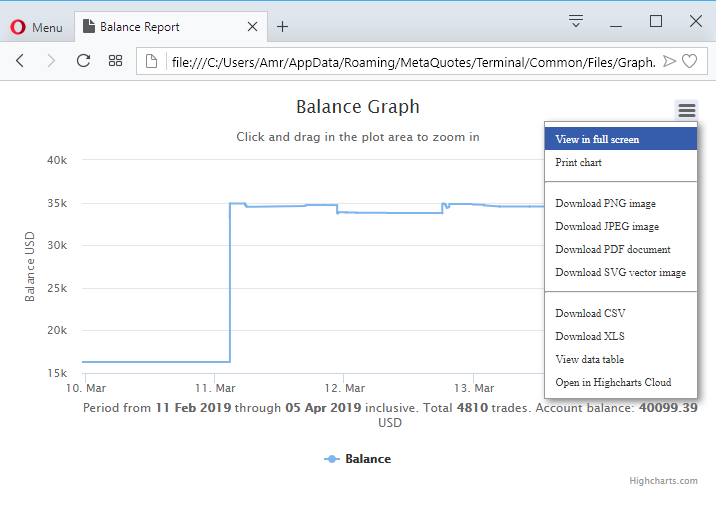
Other features:
 Triangle
"Triangle" EA draws 2 Trend Lines with fractals on chart and trades When a triangle is formed,has Trailing Stop Loss &Take Profit works with all time frames major forex pairs and stocks NASDAQ.
Trend Line By Angle
With "Trend Line By Angle" EA you can draw Trend Line By Angle on the chart and trade with price breakthrough or trend,has 3 buttons for manual trading and allows to predetermine trailing stoploss & take profit, open and close all trades at once.
ZeeZee Level
ZeeZee Level, One by One
 This ia an rainbow MA indicator based on SMA
This indicator uses various SMA to indicate a possible reversal point.