당사 팬 페이지에 가입하십시오
- 조회수:
- 11730
- 평가:
- 게시됨:
- 2019.02.15 16:06
-
이 코드를 기반으로 한 로봇이나 지표가 필요하신가요? 프리랜스로 주문하세요 프리랜스로 이동
Theory :
The original calculation of RSI is (in short) the following :
Add the changes up and changes down. From those sums, we can then calculate the RSI (Relative Strength Index). At that particular step Welles Wilder used what sometimes is called Wilders EM for smoother results, And that gives us space to [produce all sort of different RSIs by using different types of smoothing at the final step
This version :
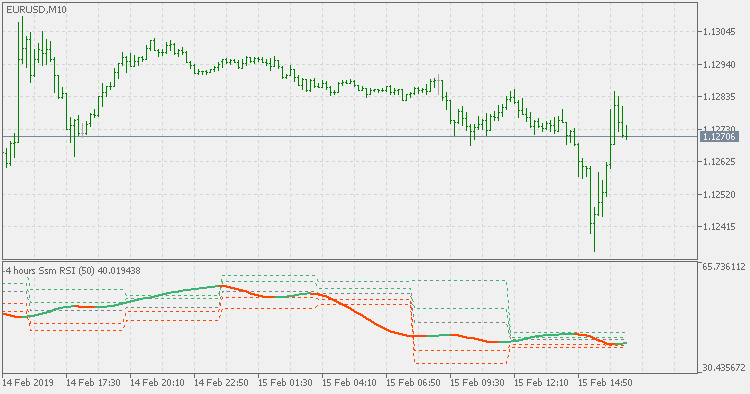
It is using super smoother for RSI calculation. It produces results similar to RSX (that was invented by Mark Jurik) but the differences are significant enough to have it as a separate type of RSI
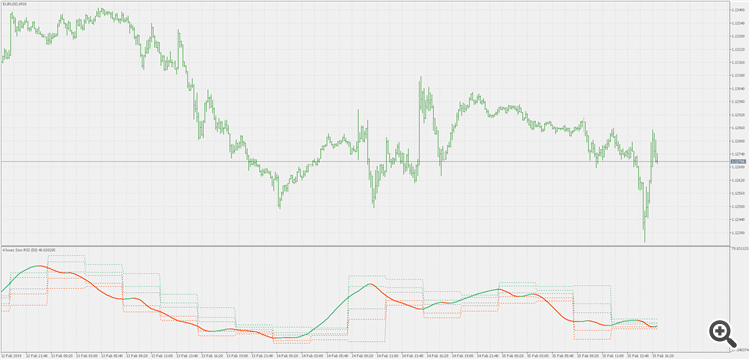
Also, this version is adding pivot calculation to such RSI. Pivots are calculated from the RSI itself, and you have 4 possible types that can be displayed :
- display pivot only
- display pivot and 1st level support and resistance
- display pivot and 1st and 2nd level support and resistance
- display pivot and 1st and 2nd and 3rd level support and resistance
The time frame selected, is used for pivots only (that time frame is used as "delimiter" for pivots). The RSI is always calculated as current time frame
Usage :
You can use it as any other RSI

 Simple support resistance
Simple support resistance
 Simple intraday support resistance
Simple intraday support resistance
