거래 로봇을 무료로 다운로드 하는 법을 시청해보세요
당사를 Twitter에서 찾아주십시오!
당사 팬 페이지에 가입하십시오
당사 팬 페이지에 가입하십시오
스크립트가 마음에 드시나요? MetaTrader 5 터미널에서 시도해보십시오
- 조회수:
- 5523
- 평가:
- 게시됨:
- 2019.01.29 12:06
-
 이 코드를 기반으로 한 로봇이나 지표가 필요하신가요? 프리랜스로 주문하세요
프리랜스로 이동
이 코드를 기반으로 한 로봇이나 지표가 필요하신가요? 프리랜스로 주문하세요
프리랜스로 이동
Theory :
Original definition of the Tushar Chande's and Stanley Kroll's DMI is the following :The dynamic momentum index is used in technical analysis to determine if a security is overbought or oversold. This indicator, developed by Tushar Chande and Stanley Kroll, is very similar to the relative strength index (RSI). The main difference between the two is that the RSI uses a fixed number of time periods (usually 14), while the dynamic momentum index uses different time periods as volatility changes, typically between five and 30.
This version is deviating from it in a number of ways :
- it is using RSX instead of RSI for calculation (thus producing a much smoother result)
- it is using standard deviation adapting to calculate that RSX
- it is adding discontinued signal lines instead of using fixed levels for OB/OS signal
Usage :
You can use color changes as signals. Color change can be one of the following :
- color change on slope change
- color change on outer dsl signal lines cross
- color change on middle dsl signal lines cross. the middle signal line is calculated as the average of upper and lower, which makes it a good new "zero" line (or 50 line in case of DMI)
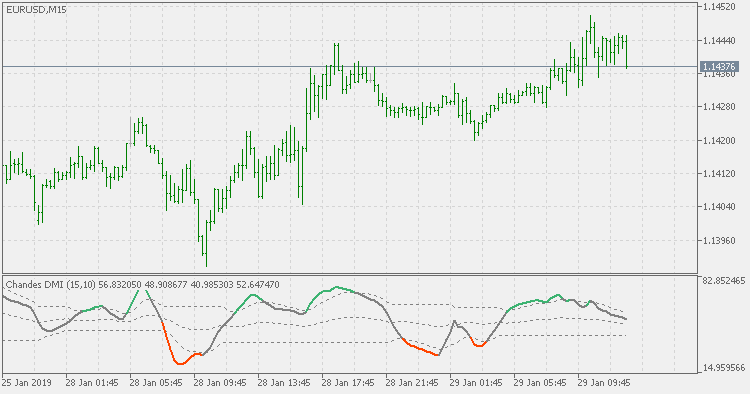
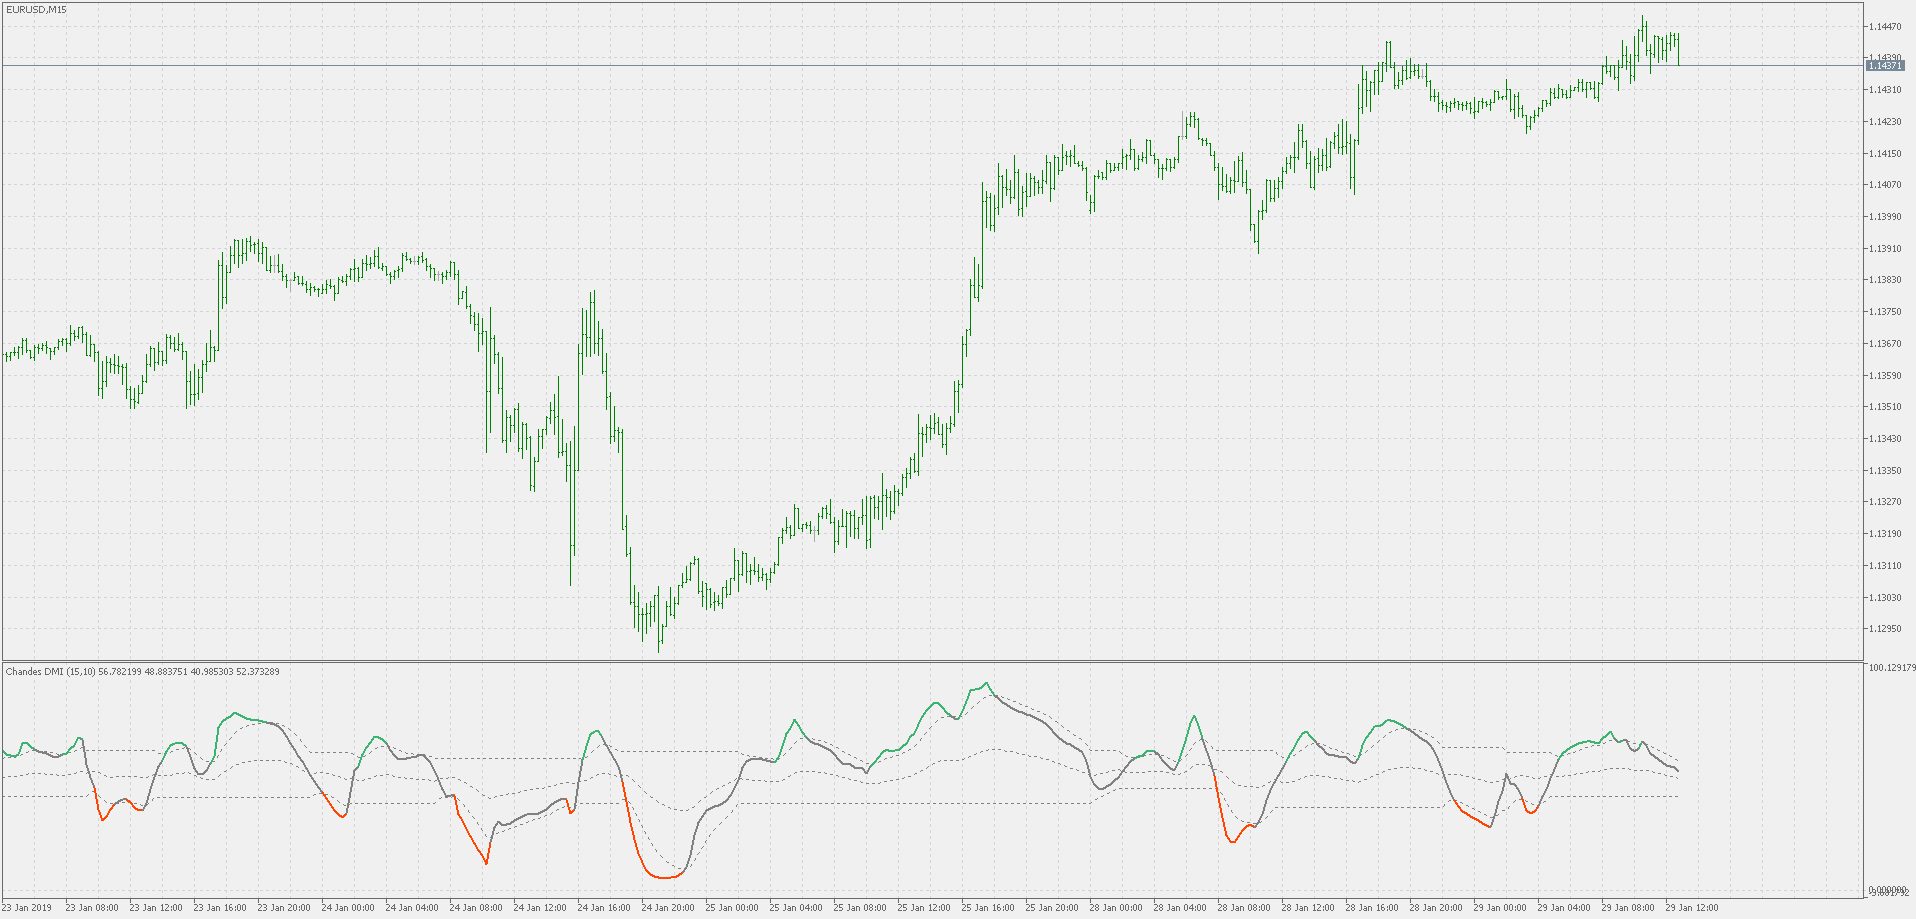
 Chande's DMI - std adaptive with floating levels
Chande's DMI - std adaptive with floating levels
Volatility ratio
Volatility ratio - standard deviations based