거래 로봇을 무료로 다운로드 하는 법을 시청해보세요
당사를 Telegram에서 찾아주십시오!
당사 팬 페이지에 가입하십시오
당사 팬 페이지에 가입하십시오
스크립트가 마음에 드시나요? MetaTrader 5 터미널에서 시도해보십시오

- 조회수:
- 18822
- 평가:
- 게시됨:
-
 이 코드를 기반으로 한 로봇이나 지표가 필요하신가요? 프리랜스로 주문하세요
프리랜스로 이동
이 코드를 기반으로 한 로봇이나 지표가 필요하신가요? 프리랜스로 주문하세요
프리랜스로 이동
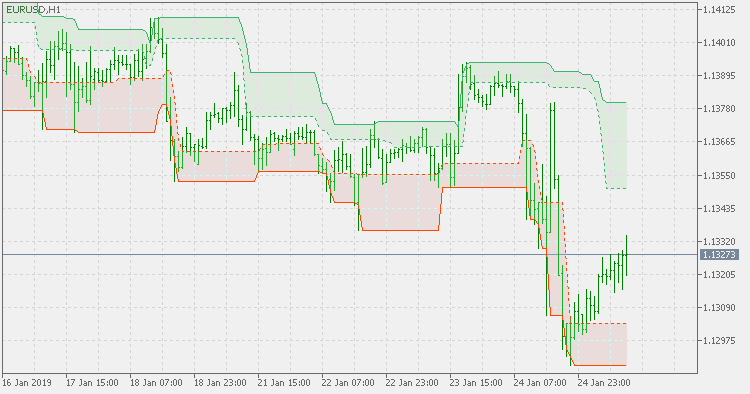
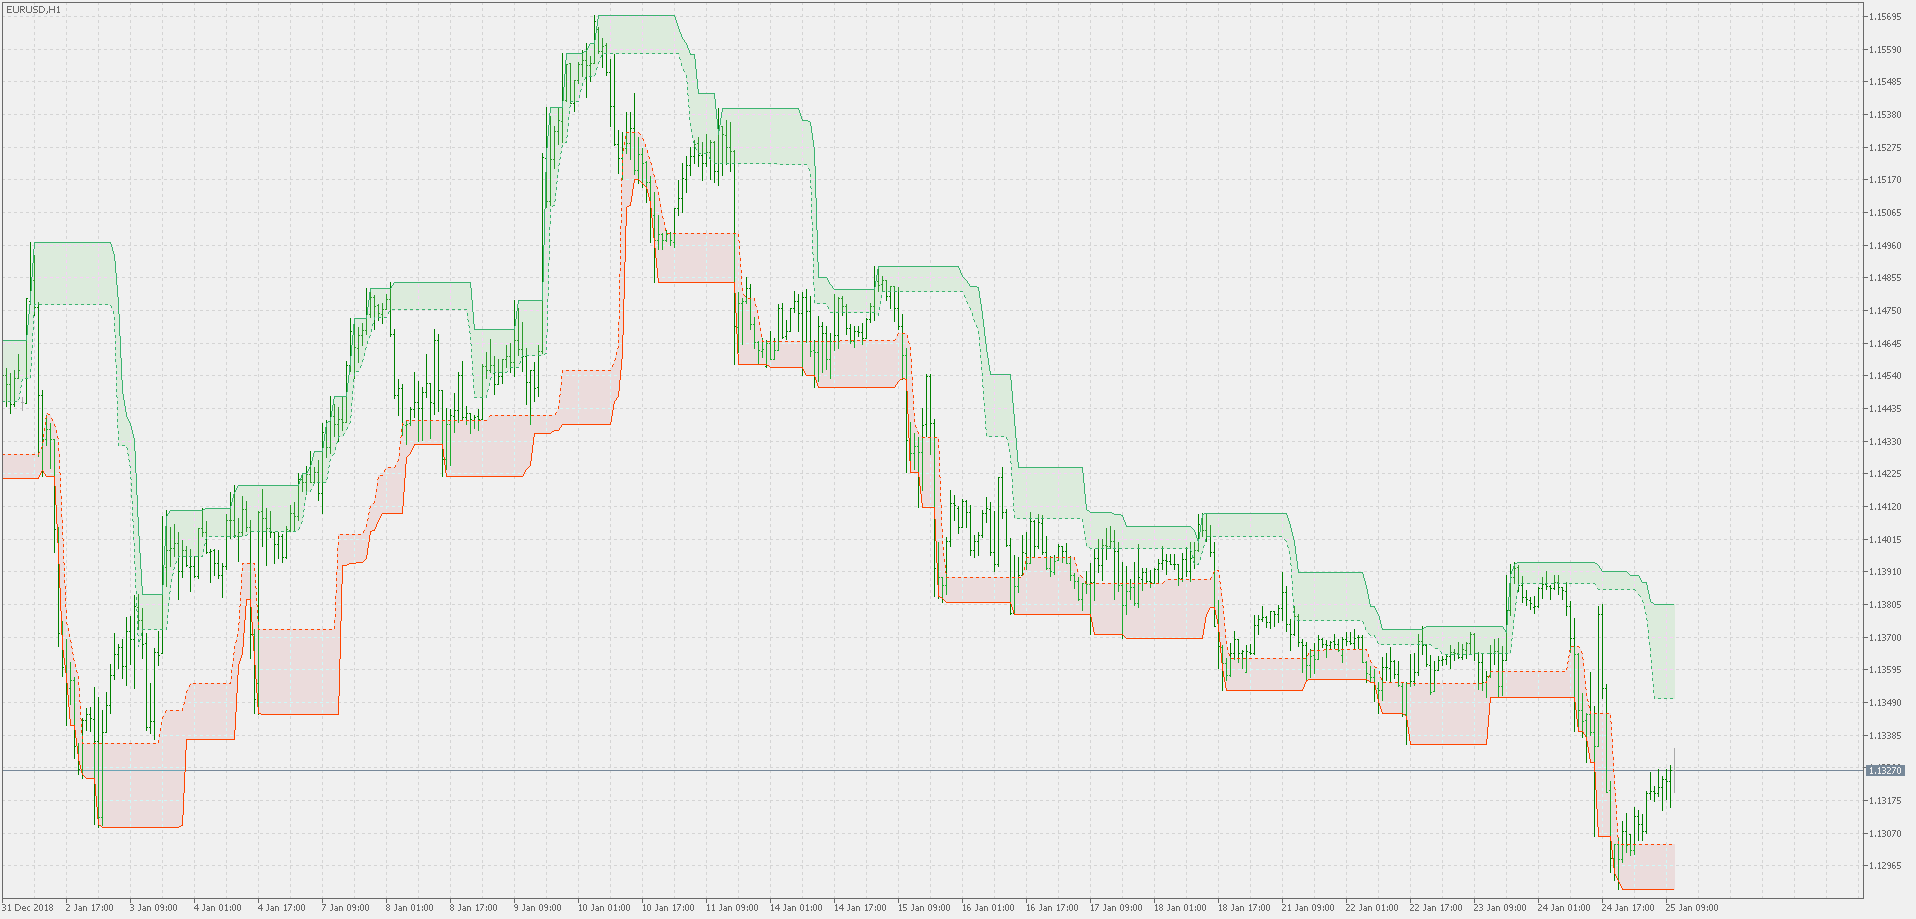
Theory :
The Donchian channel is an indicator used in market trading developed by Richard Donchian. It is formed by taking the highest high and the lowest low of the last n periods. The area between the high and the low is the channel for the period chosen.Donchian Channel Formula
- The upper band is calculated as the highest high for the selected period.
- The lower band is calculated as the lowest low for the selected period.
- The selected period does not include the day on which the band is plotted (otherwise the band would never be crossed). For example, the 20-Day Donchian Channels for today are the highest high and lowest low for the preceding 20 trading days.
This version is not calculating only the channel itself, but is calculation a sort of support and resistance "sub"channels" within the existing Donchian channel. That way we can estimate the "price action" a bit more accurate
Usage :
It can be used as any "regular" Donchian channel, but also can be used for support and resistance levels assessment
 Smoother rainbow
Smoother rainbow
Asymmetric bands oscillator - extended
Asymmetric bands oscillator - extended version