거래 로봇을 무료로 다운로드 하는 법을 시청해보세요
당사를 Twitter에서 찾아주십시오!
당사 팬 페이지에 가입하십시오
당사 팬 페이지에 가입하십시오
스크립트가 마음에 드시나요? MetaTrader 5 터미널에서 시도해보십시오
- 조회수:
- 10479
- 평가:
- 게시됨:
- 2018.12.10 11:33
-
 이 코드를 기반으로 한 로봇이나 지표가 필요하신가요? 프리랜스로 주문하세요
프리랜스로 이동
이 코드를 기반으로 한 로봇이나 지표가 필요하신가요? 프리랜스로 주문하세요
프리랜스로 이동
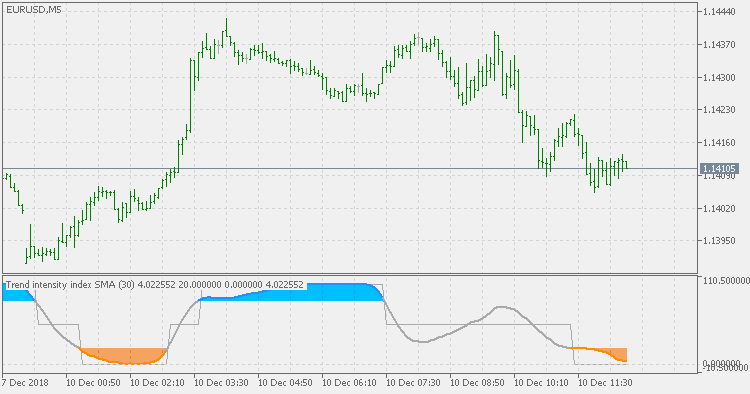
Theory :
It was created by M.H.Pee. The definition (in short) is the following :
To calculate a 30-day trend intensity index (TII), follow these steps:
- Obtain the 60-day simple moving average by adding the closes for the past 60 days and dividing the result by 60.
- Find the deviation of each of the recent 30 closes from the 60-day moving average. The deviation is up if the close is above the moving average, and down when the close is below the average. Up deviation values are obtained by subtracting the moving average from the close, while down deviations are calculated by subtracting the close from the moving average. The TII allows you to find out what percentage of these deviations is up or down. For a 30-day TII , you should have 30 deviations from the 60-day moving average.
Usage :
You can use color changes as signals
 Trade signal based on PullBack and Candle (for MQL5 Wizard)
This is the trading signal of PullBack and Candle. The expert code for this strategy is automatically generated by the MQL 5 wizard.
 Trend detection index
Trend detection index
Phase change index 2
Phase change index 2
BB stops - Hull average
BB stops - Hull average based with multiple stops included