당사 팬 페이지에 가입하십시오
- 게시자:
- Vladimir Karputov
- 조회수:
- 7695
- 평가:
- 게시됨:
- 2019.02.07 09:02
-
이 코드를 기반으로 한 로봇이나 지표가 필요하신가요? 프리랜스로 주문하세요 프리랜스로 이동
Idea by: Scriptor
mq5 code by: barabashkakvn
The EA refers to the data of two indicators iMA (Moving Average, MA), Fast and Slow, and of one indicator iBands (Bollinger Bands, BB). The indicators work on the current symbol and on the current timeframe.
Trailing the positions and trading signals are generated only when a new bar appears. You can also reverse trading signals (parameter Reverse, variable InpReverse in the code) and close positions opposite to the trading signal (parameter Close opposite, variable InpCloseOpposite in the code).
Block of trading signals:
   if(ma_fast[2]<ma_slow[2] && ma_fast[1]>ma_slow[1] && close[1]<bands_lower[1])
     {
      if(!InpReverse)
         m_need_open_buy=true;
      else
         m_need_open_sell=true;
     }
   if(ma_fast[2]>ma_slow[2] && ma_fast[1]<ma_slow[1] && close[1]>bands_lower[1])
     {
      if(!InpReverse)
         m_need_open_sell=true;
      else
         m_need_open_buy=true;
     }
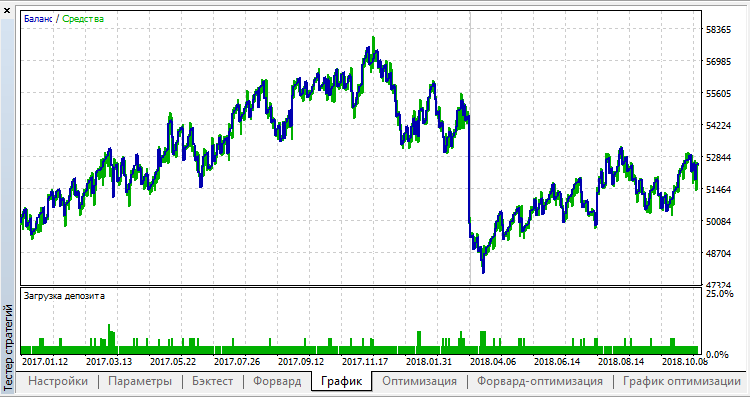
EURUSD, H1:

MetaQuotes Ltd에서 러시아어로 번역함.
원본 코드: https://www.mql5.com/ru/code/23556
 Horizontal Line Levels
Signal (Alert) at crossing horizontal line by the price
 HLCrossSigForDeMarker
The HLCrossSigForDeMarker is considered as a trend indicator since it is intended for "catching" trends. However, it's a pretty complex and informative indicator that allows excluding the psychological and emotional effects from trading.
 BollingerBands_Box
Displaying the latest closed values of indicator Bollinger Bands® with colored rectangles and background filling
 PEMA_2HTF
A colored cloud made of two PEMAs from different timeframes on a single chart.