당사 팬 페이지에 가입하십시오
- 조회수:
- 23080
- 평가:
- 게시됨:
- 2018.11.25 16:10
-
 이 코드를 기반으로 한 로봇이나 지표가 필요하신가요? 프리랜스로 주문하세요
프리랜스로 이동
이 코드를 기반으로 한 로봇이나 지표가 필요하신가요? 프리랜스로 주문하세요
프리랜스로 이동
Theory :
This is an old idea : using the highest high and lowest low as support resistance.
This version :
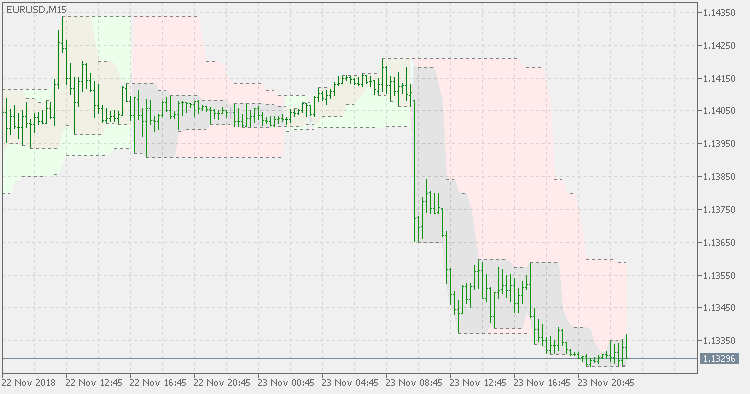
It is combining two highest high & lowest low calculations. The "slow" channel formed that way is treated as the "trend" determining channel. The "fast" channel is is the short term channel drawn within the "main" longer term channel. That way you have a combination of fast and slow estimations of SR and short term trends within the current trend. Of course, the estimation of the trend is based on highest high & lowest low, and even though it does not repaint, it is to be used as any normal trend based on such values
Usage :
The "fast" channel can be used for short term support resistance (or targets for exits - depending on your trading strategy). Same can be done using long term channel.
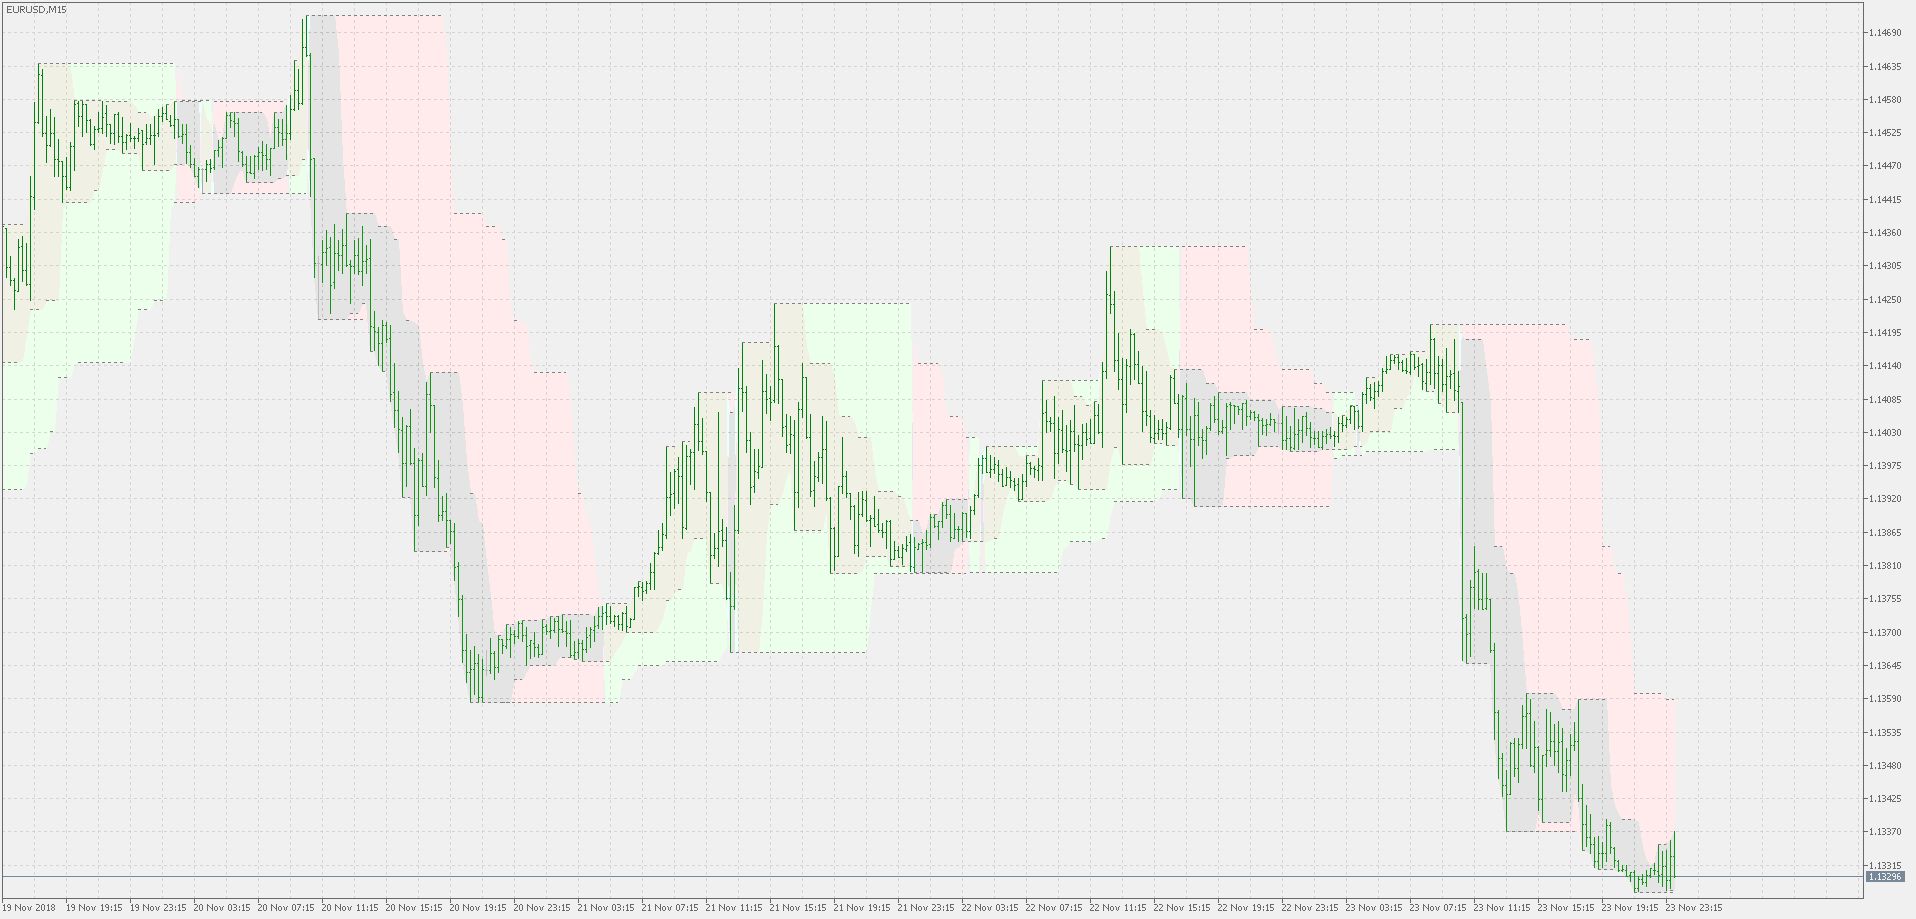
PS: the "big picture" example
 RSI divergence candles
RSI divergence candles
Filtered deviation scaled MA
Filtered deviation scaled MA
Momentum ratio oscillator
Momentum ratio oscillator
 Trade signal based on simple Bollinger bands
This is the trading signal of Bollinger Bands. The expert code for this strategy is automatically generated by the MQL 5 wizard.