거래 로봇을 무료로 다운로드 하는 법을 시청해보세요
당사를 Facebook에서 찾아주십시오!
당사 팬 페이지에 가입하십시오
당사 팬 페이지에 가입하십시오
스크립트가 마음에 드시나요? MetaTrader 5 터미널에서 시도해보십시오
- 조회수:
- 20118
- 평가:
- 게시됨:
- 2018.11.24 13:55
-
 이 코드를 기반으로 한 로봇이나 지표가 필요하신가요? 프리랜스로 주문하세요
프리랜스로 이동
이 코드를 기반으로 한 로봇이나 지표가 필요하신가요? 프리랜스로 주문하세요
프리랜스로 이동
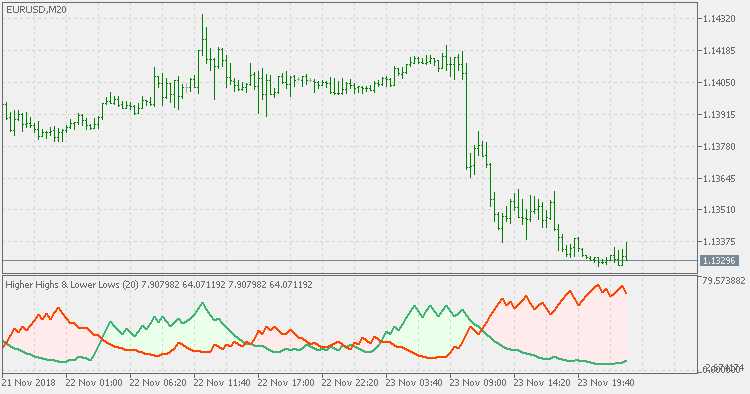
Theory :
According to Vitali Apirine’s article “Higher Highs & Lower Lows,” in in February 2016 issue of TASC, the momentum indicator-based system HHLLS (higher high, lower low stochastic) can help to spot emerging trends, define correction periods, and anticipate reversals. As with many indicators, HHLLS signals can also be generated by looking for divergences and crossovers. Because the HHLLS is an oscillator, it can also be used to identify overbought & oversold levels.
Usage :
You can use the color change of the fill zone (ie: the crosses of the two values) as signals
 Stochastic extended - floating levels
Stochastic extended - floating levels
MACD slope divergence
MACD slope divergence
CCI of average - floating levels
CCI of average - floating levels
Deviation scaled MA - extended
Deviation scaled MA - extended