당사 팬 페이지에 가입하십시오
- 조회수:
- 6218
- 평가:
- 게시됨:
- 2019.01.02 14:40
-
 이 코드를 기반으로 한 로봇이나 지표가 필요하신가요? 프리랜스로 주문하세요
프리랜스로 이동
이 코드를 기반으로 한 로봇이나 지표가 필요하신가요? 프리랜스로 주문하세요
프리랜스로 이동
Bollinger Bands are used for calculating overbought/oversold zones.
There are four input parameters:
- MFI period - MFI calculation period
- MFI applied volume - volume used for MFI calculation
- BB period - Bollinger Bands calculation period
- BB deviation - Bollinger Bands deviation
Calculation:
NormMFI = (MFI-BL) / (TL-BL)
where:
TL = BBands(MFI, BB period, BB deviation, UPPER_BAND)
BL = BBands(MFI, BB period, BB deviation, LOWER_BAND)
MFI - Money Flow Index(MFI period, MFI applied volume)
BBands - UPPER_BAND and LOWER_BAND of Bollinger Bands
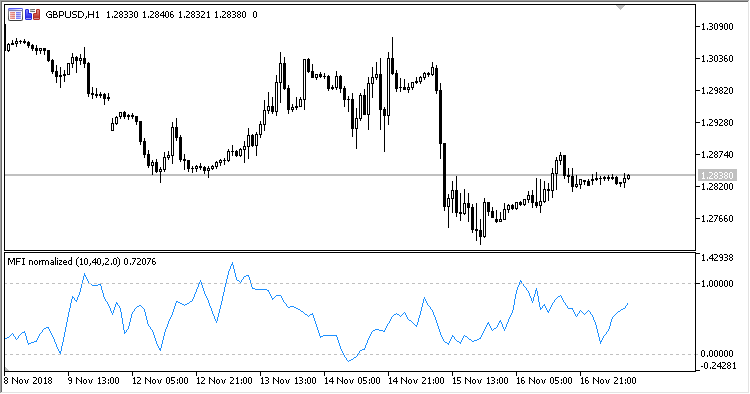
Fig.1. MFI normalized
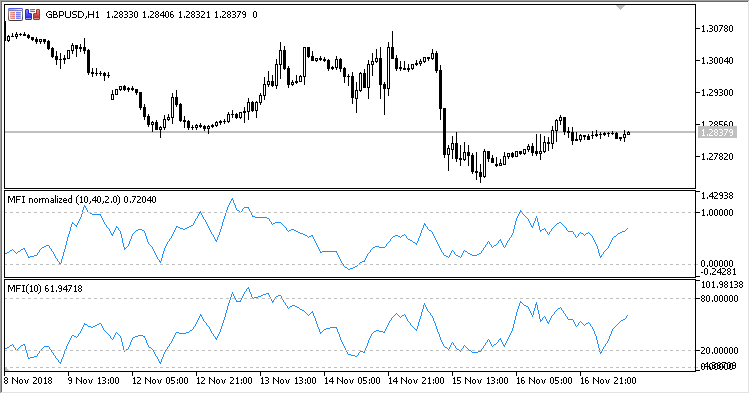
Fig.2. MFI normalized + MFI
MetaQuotes Ltd에서 러시아어로 번역함.
원본 코드: https://www.mql5.com/ru/code/23285
 ColorMFI_X20_Cloud
The ColorMFI_X20 indicator featuring background filling in overbought/oversold areas
ColorMFI_X20
Twenty MFI indicators displayed in one window. Each line can be colored depending on its position relative to overbought and oversold areas
CandlesAutoFibo
The indicator builds Fibonacci levels at candlesticks High and Low, based on the timeframe specified in the indicator parameters
XFisher_org_v1_Vol_Supr_Zer_HTF
The XFisher_org_v1_Vol_Supr_Zer indicator with the possibility to change the indicator timeframe using input parameters