당사 팬 페이지에 가입하십시오
- 조회수:
- 5536
- 평가:
- 게시됨:
- 2014.06.02 11:06
- 업데이트됨:
- 2016.11.22 07:32
-
이 코드를 기반으로 한 로봇이나 지표가 필요하신가요? 프리랜스로 주문하세요 프리랜스로 이동
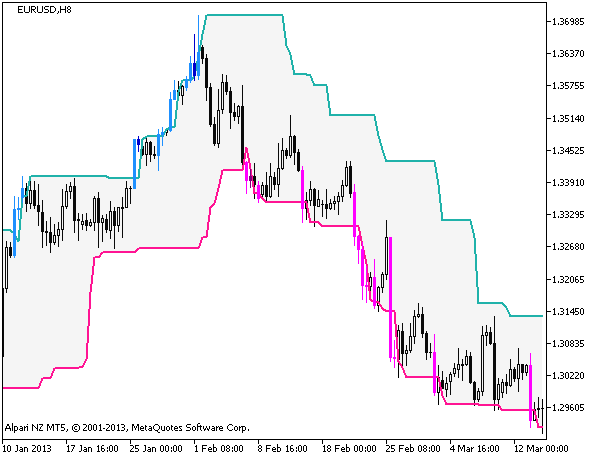
The indicator implements a breakthrough system using a channel drawn on extrema for a period.
When price exits the gray channel, the candlestick color changes to the color corresponding to trend direction. Blue for the growth of a financial asset, pink color - fall. Bright colors denote coincidence of trend direction and direction of a candlestick. Dark colors correspond to the situation when the direction of a candlestick is opposite to trend.

Figure 1. The PChannel_System indicator
MetaQuotes Ltd에서 러시아어로 번역함.
원본 코드: https://www.mql5.com/ru/code/2328
 Linear_Price_Bar
A candlestick chart, all the Open prices of which are shifted to zero.
 Tally for Wins and Losses
Way to keep a tally of wins an losses.
 DynamicRS_C
A trend indicator of the series of indicators without averaging.
 MultiHighsLowsSignal
The MultiHighsLowsSignal indicator shows information on active trends using the values of seven HighsLowsSignal indicators from different timeframes.