당사 팬 페이지에 가입하십시오
- 조회수:
- 3856
- 평가:
- 게시됨:
- 2018.11.20 12:49
-
이 코드를 기반으로 한 로봇이나 지표가 필요하신가요? 프리랜스로 주문하세요 프리랜스로 이동
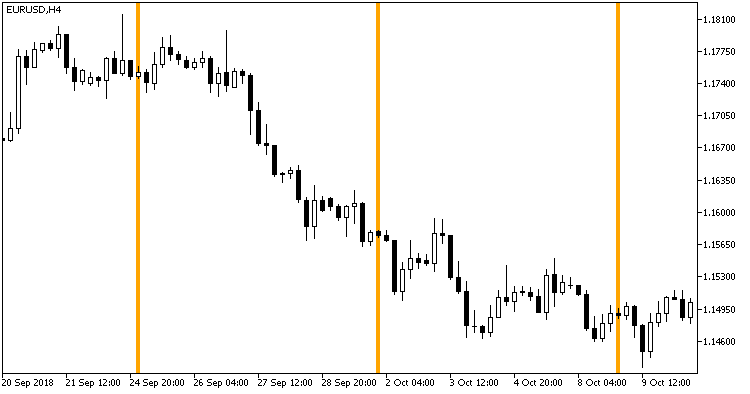
The indicator plots one vertical line per day in a specified moment of time once per week. Lines are drawn using indicator buffers and DRAW_HISTOGRAM2 graphical construction type. It is recommended to place the indicator on the main chart before attaching other indicators.

Fig. 1. Time_Bar_Custom_Weekly indicator in the main chart window
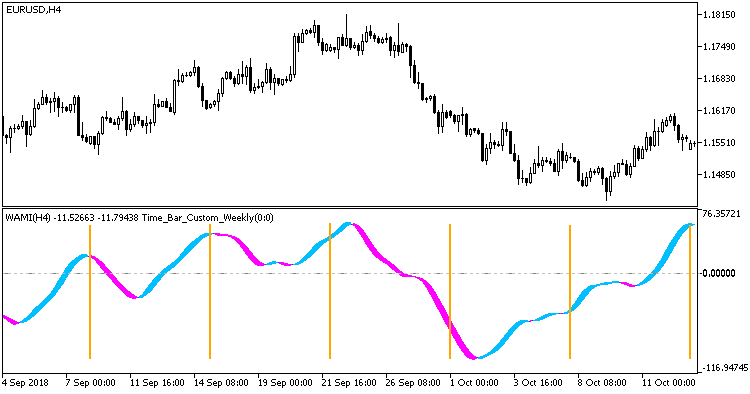
You can also place the indicator in the additional windows of other indicators simply by dragging it to these windows from the Navigator window.

Fig. 2. Time_Bar_Custom_Weekly indicator in the additional window of another indicator
MetaQuotes Ltd에서 러시아어로 번역함.
원본 코드: https://www.mql5.com/ru/code/23009
 ColorXFisher_org_v1_X20
XFisher_org_v1_X20 indicator is able to color each line depending on its position relative to overbought and oversold areas
 ColorXFisher_org_v1_X20_Cloud
XColorFisher_org_v1_X20 indicator featuring background filling in overbought/oversold areas