당사 팬 페이지에 가입하십시오
- 조회수:
- 16015
- 평가:
- 게시됨:
- 2018.10.26 11:42
- 업데이트됨:
- 2018.10.26 11:42
-
 이 코드를 기반으로 한 로봇이나 지표가 필요하신가요? 프리랜스로 주문하세요
프리랜스로 이동
이 코드를 기반으로 한 로봇이나 지표가 필요하신가요? 프리랜스로 주문하세요
프리랜스로 이동
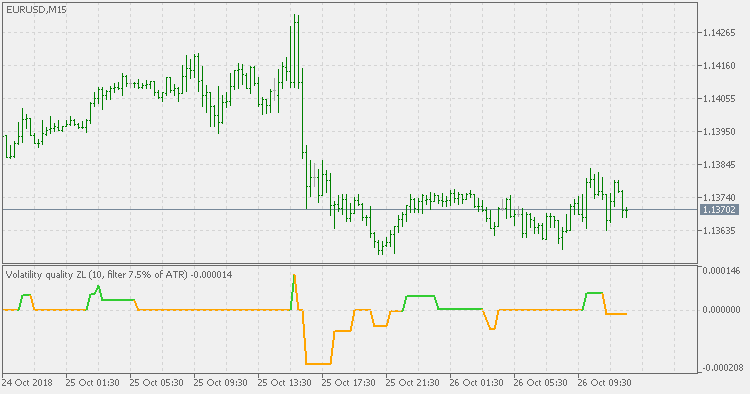
Theory :
Originally volatility quality was invented by Thomas Stridsman, and he uses it in combination of two averages (original was published, with some more explanation, here : Volatility quality Stridsman)
This version :
It is not using averages for trend estimation, but is using the slope of the Volatility quality. In order to lessen the number of signals (which can be enormous if the VQ is not filtered), some versions similar to this are using pips filters. This version is using % of ATR (Average True Range) instead. The reason for that is that :
- using fixed pips value as a filter will work on one symbol and will not work on another
- changing time frames will render the filter worthless since the ranges of higher time frames are much greater than those at lower time frames, and, when you set your filter on one time frame and then try it on another, it is almost certain that it will have to be adjusted again
- to avoid that this indicator is using ATR % for filtering and that automatically adjusts it to symbols and time frames
Additionally, this version is made to oscillate around zero line (which makes the potential levels, which are even in the original Stridsman's version doubtful, unnecessary)
Usage :
You can use the color change as signals when using this indicator
 Volatility quality
Volatility quality with ATR filter
Nonlinear Kalman filter deviation
Nonlinear Kalman filter deviation
Stripped T3 levels
Stripped T3 levels (T3 levels that can display the 3 phases of T3 calculation)
MinMax indicator
MinMax indicator