거래 로봇을 무료로 다운로드 하는 법을 시청해보세요
당사를 Telegram에서 찾아주십시오!
당사 팬 페이지에 가입하십시오
당사 팬 페이지에 가입하십시오
스크립트가 마음에 드시나요? MetaTrader 5 터미널에서 시도해보십시오
- 조회수:
- 4987
- 평가:
- 게시됨:
- 2018.10.22 19:51
- 업데이트됨:
- 2019.01.29 15:37
-
 이 코드를 기반으로 한 로봇이나 지표가 필요하신가요? 프리랜스로 주문하세요
프리랜스로 이동
이 코드를 기반으로 한 로봇이나 지표가 필요하신가요? 프리랜스로 주문하세요
프리랜스로 이동
Theory:
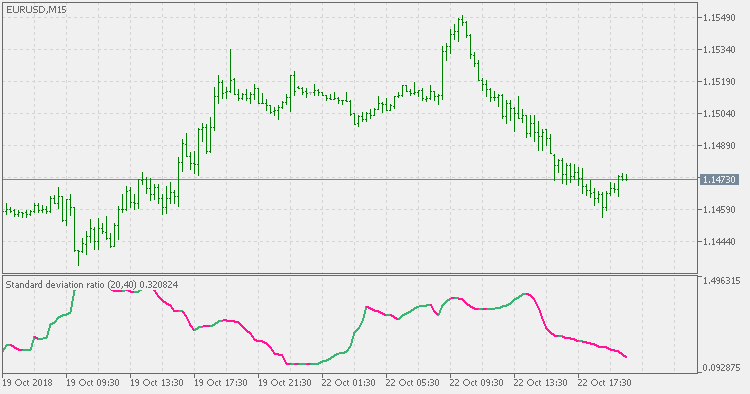
The Standard Deviation Ratio (SDR) was first presented as a technical indicator in the March 1992 edition of Technical Analysis of Stocks & Commodities magazine ‘Adapting Moving Averages To Market Volatility‘. The author Tushar S. Chande, Ph.D. used it as the Volatility Index in the original version of his Volatility Index Dynamic Average (VIDYA) or Variable Moving Average (VMA).Calculating it is as simple as taking the ratio of a Standard Deviation (SD) over one period to that of a longer period where both have the same starting point. One quirk of the SDR is that because the short term SD can become greater than the longer term SD, the ratio has no upper limit but does tend to remain below 1 most of the time (see the example chart below). The higher the ratio, the more spread the recent data is from the mean in relation to the past which should indicate a stronger trend.
Usage:
The standard deviation ratio (SDR) on its own can be used in a similar mode as the regular standard deviation - as a measure of current market volatility (ie: it is not a directional indicator and it can not be used for trend direction determination - for that you need some other indicator combined with this one)
 Step VHF adaptive VMA
Step VHF adaptive VMA
Averages composite trend
Trend composed by a series of averages
Standard deviation ratio adaptive EMA
Standard deviation ratio adaptive EMA
 Tunnel Method
Trading based on three iMAs (Moving Average, MA)