당사 팬 페이지에 가입하십시오
- 조회수:
- 13799
- 평가:
- 게시됨:
- 2018.10.13 16:14
-
 이 코드를 기반으로 한 로봇이나 지표가 필요하신가요? 프리랜스로 주문하세요
프리랜스로 이동
이 코드를 기반으로 한 로봇이나 지표가 필요하신가요? 프리랜스로 주문하세요
프리랜스로 이동
Basics :
The true strength index (TSI) is a technical indicator used in the analysis of financial markets that attempts to show both trend direction and overbought/oversold conditions. It was first published William Blau in 1991. The indicator uses moving averages of the underlying momentum of a financial instrument. Momentum is considered a leading indicator of price movements, and a moving average characteristically lags behind price. The TSI combines these characteristics to create an indication of price and direction more in sync with market turns than either momentum or moving average.
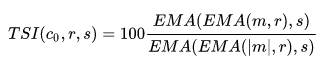
The formula for the TSI is:
where:
c0 = today's closing price
m = c0 − c1 = momentum (difference between today's and yesterday's close)
EMA(m,n) = exponential moving average of m over n periods
r = EMA smoothing period for momentum, typically 25
s = EMA smoothing period for smoothed momentum, typically 13
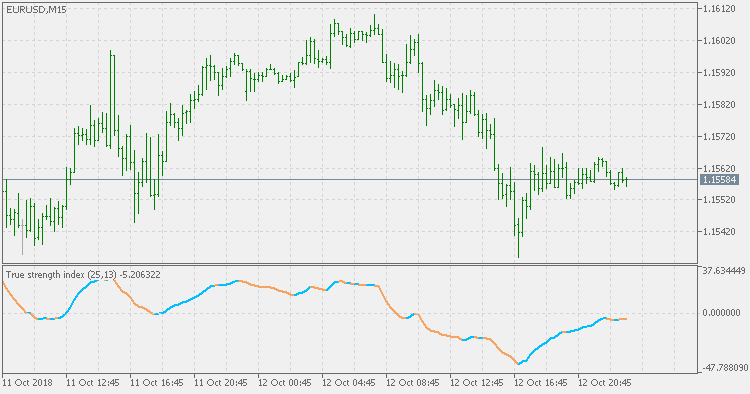
This version :
There are some versions for MT5 already but they are deviation from the original formula described by William Blau. So, this version is "to the letter" as the original is described (above too)
Usage :
You can use the color change of TSI as a signal foo a momentum assessment, or you can use zero line crosses for linger term trend change signals
 Four clicks to draw an arc-shaped channel
A quick way to draw an arc-shaped channel in 4 mouse clicks.
ATR adaptive smooth Laguerre RSI (dlvl)
ATR adaptive smooth Laguerre RSI with dynamic levels