당사 팬 페이지에 가입하십시오
- 조회수:
- 4823
- 평가:
- 게시됨:
- 2018.12.18 19:08
-
이 코드를 기반으로 한 로봇이나 지표가 필요하신가요? 프리랜스로 주문하세요 프리랜스로 이동
Real author:
Bigeev Rustem
The HLCrossSigForRSI is considered as a trend indicator since it is intended for "catching" trends. However, it's a pretty complex and informative indicator that allows excluding the psychological and emotional effects from trading.
This indicators shows levels for opening positions, setting stop levels, Trailing Stop and Take Profit leaving no doubts for a trader regarding performing a deal. Avoiding psychological and emotional influence in trading is a key factor for getting a profit on the market.
Inputs:
//+----------------------------------------------+
//| Indicator inputs                             |
//+----------------------------------------------+
input int Supr_Period=6;                       //Period of the breakthrough range; the greater is the value, the later and rarer are the signals
input int MA_Period=21;                        //Heiken Ashi variable period. Used as an additional filter
input int Risk=0;                              //Maximal risk in pips, used for calculation of the level of entering on the basis of a closest MAX/MIN level
input int ATR_Period=120;                      //АТR period. Used for calculation of volatility.
input double Q=0.7;                            //Parameter for placing Take Profit. - A rate of Stop Loss. If =1, take profit = stop loss
input int RSI_Period=12;                       //RSI period. Used as an additional filter
input ENUM_APPLIED_PRICE RSIPrice=PRICE_CLOSE; //RSI price
input int HLine=60;                            //Upper signal line of stop levels for RSI
input int LLine=40;                            //Lower signal line of stop levels for RSI
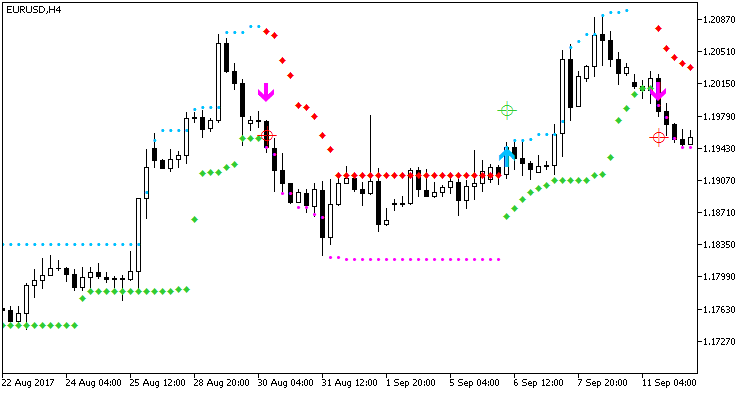
Displayed elements of the indicator:
- Up and down arrows are signals for opening the corresponding positions;
- Circles on crosshairs are points for placing initial Take Profit;
- Dots are used for confirmation of determined trend. If the price continuously breaks through the levels of these points, one should keep the position as long as it is possible. If points represent a "corridor" for a long period, it is time for fix the profit;
- Diamonds are limits for placing Stop Loss and Trailing Stop.

Fig. 1. HLCrossSigForRSI indicator
MetaQuotes Ltd에서 러시아어로 번역함.
원본 코드: https://www.mql5.com/ru/code/22643
 XBullsBearsEyes_Vol_Direct_HTF
XBullsBearsEyes_Vol_Direct indicator with the timeframe selection option available in input parameters
 Hans_Indicator_x22_Cloud_System_Alert
The indicator of expanding time zone corridors with the background color filling and the channel Hans_Indicator_x22_Cloud_System average line. The indicator provides alerts, sends email and push notifications when the formed corridor expansion is broken.
 Linear_Regression_Slope
Linear regression slope indicator
 GHLA_ST_Bar
Gann HiLo Activator/SuperTrend Bar indicator