당사 팬 페이지에 가입하십시오
- 조회수:
- 8313
- 평가:
- 게시됨:
- 2018.12.18 19:21
-
이 코드를 기반으로 한 로봇이나 지표가 필요하신가요? 프리랜스로 주문하세요 프리랜스로 이동
The indicator colors candles based on data from AO and AC indicators.
There are five inputs:
- Data source - data source for calculating AO and AC
- Price - price
- Heiken Ashi - Heiken Ashi
- Fast MA period - fast МА period for calculating AO and AC
- Slow MA period - slow МА period for calculating AO and AC
- AC period - AC calculation period
- Calculating method - calculation method
- AO - AO only
- AC - AC only
- AO+AC - both indicators
If AO line and/or AC is directed upwards, this is a bullish direction
If AO line and/or AC is directed downwards, this is a bearish direction
When AO and AC indicators coincide, the appropriate bullish or bearish zone is registered.
The neutral area is registered if AO and AC directions do not match. It may only happen in the Calculating method = AO+AC mode
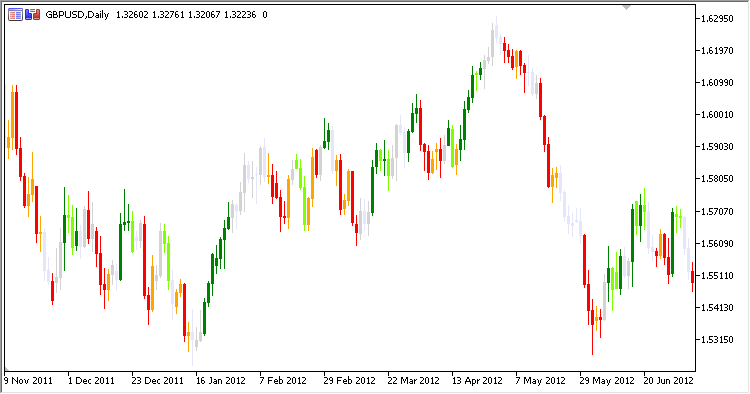
A bullish candle in a bullish area is colored green
A bearish candle in a bullish area is colored light-green
A bearish candle in a bearish area is colored red
A bullish candle in a bearish area is colored light-red
A bullish candle in a neutral area is colored gray
A bearish candle in a neutral area is colored light-gray

Fig. 1. Heiken Ashi Zone Trade. The data source is a price

Fig. 2. Heiken Ashi Zone Trade. Data source - Heiken Ashi
MetaQuotes Ltd에서 러시아어로 번역함.
원본 코드: https://www.mql5.com/ru/code/22430
 Exp_TimeZonePivotsOpenSystem
The trading system based on the signals of the TimeZonePivotsOpenSystem indicator
 XWPR_Histogram_Vol_HTF
XWPR_Histogram_Vol indicator with the timeframe selection option available in input parameters