당사 팬 페이지에 가입하십시오
- 조회수:
- 4788
- 평가:
- 게시됨:
- 2018.09.16 13:50
-
 이 코드를 기반으로 한 로봇이나 지표가 필요하신가요? 프리랜스로 주문하세요
프리랜스로 이동
이 코드를 기반으로 한 로봇이나 지표가 필요하신가요? 프리랜스로 주문하세요
프리랜스로 이동
Basics :
Stochastic indicator (originally developed in 1950 by George Lane) is due to its very long usage, well known and is widely used indicator. Sometimes it is used in a combination of some filtering method (mostly with a signal line which we can treat as that filtering method) in order to avoid some of the false signals that stochastic might produce in some market conditions. This is one more version that will attempt to address the issue by using two filters on this version of stochastic
This version :
This version is using step chart as a filter to lessen the number of signals produced by stochastic and (if possible) to make it easier and safer to use. The step size is to be entered as stochastic % that you wish to be used as a filter for minimal stochastic change that should be considered as a significant change. It also can use averages for price filtering prior to be used in stochastic calculation. That way the stochastic can be "double filtered" (filtering the price prior to be used in stochastic calculation and then using the step chart filter on the calculated stochastic result). The averages that can be used in this version :
- simple moving average
- exponential moving average
- smoothed moving average
- linear weighted moving average
Usage :
You can use color change of the step bar as signals
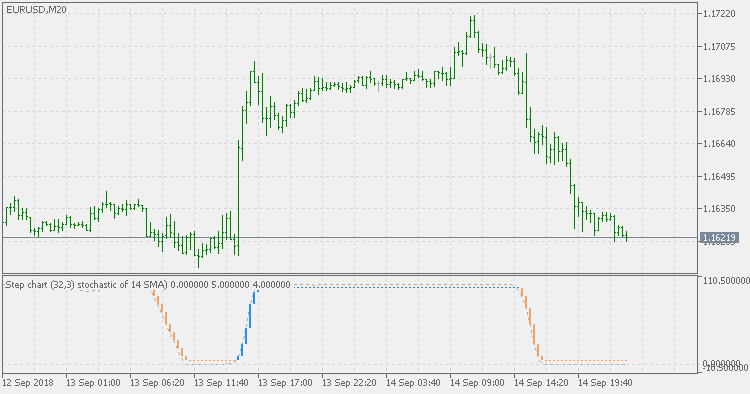
 Step chart of stochastic
Step chart of stochastic
Step chart of CCI of averages
Step chart of CCI of averages