당사 팬 페이지에 가입하십시오
- 조회수:
- 6368
- 평가:
- 게시됨:
- 2018.09.12 18:03
-
이 코드를 기반으로 한 로봇이나 지표가 필요하신가요? 프리랜스로 주문하세요 프리랜스로 이동
Original definition :
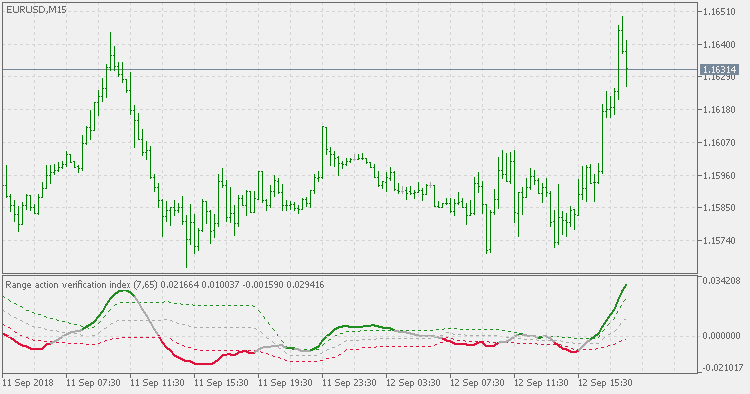
The Chande's Range Action Verification Index (RAVI) indicator was developed by Tushar Chande. As the ADX indicator, the RAVI is used to identify whether a market or security is trending. The RAVI indicator is calculated using moving averages of different lengths. The first one is a short moving average with a lookback period of 7 bars. The second one is a long moving average with a lookback period of 65 bars. The indicator returns a percentage value. Above a certain threshold, the market is considered trending.
Interpretation:
The market is considered trending if the RAVI value is above 3%. Otherwise, the market is consolidating
Changes :
Due to its nature, the levels mentioned in the original description are largely arbitrary and in some cases will never be reached (depending on symbol and time frame). This version is using levels that are adjusted to the value and that way it makes the indicator work the same on any symbol and any time frame
Usage :
All the usual : using color changes for trend start and possible re-entries

 RSI adaptive EMA - floating levels
RSI adaptive EMA - floating levels
 RSI adaptive EMA ribbon
RSI adaptive EMA ribbon
 Kaufman ama - with floating levels
Kaufman ama - with floating levels
 Support and Resistance Trader
Expert adviser scans past 500 closing bars and looks for common closing regions as entries.