거래 로봇을 무료로 다운로드 하는 법을 시청해보세요
당사를 Telegram에서 찾아주십시오!
당사 팬 페이지에 가입하십시오
당사 팬 페이지에 가입하십시오
스크립트가 마음에 드시나요? MetaTrader 5 터미널에서 시도해보십시오
- 조회수:
- 3531
- 평가:
- 게시됨:
- 업데이트됨:
-
이 코드를 기반으로 한 로봇이나 지표가 필요하신가요? 프리랜스로 주문하세요 프리랜스로 이동
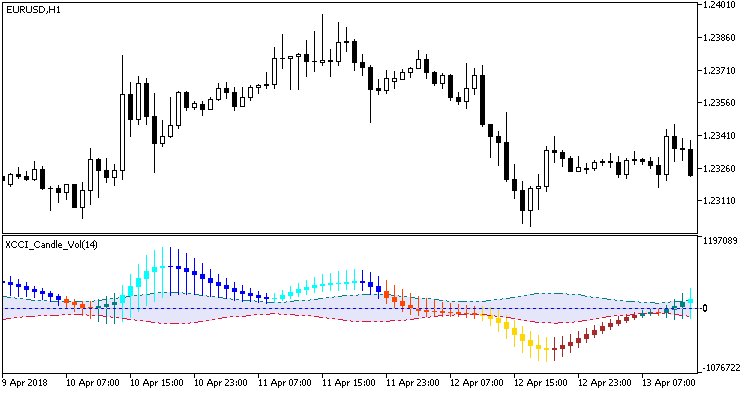
CCI_Candle_Vol indicator with additional averaging of the resulting candles. A similar averaging is applied to dynamic overbought/oversold levels as well.
//+-----------------------------------------+
//|  INDICATOR INPUT PARAMETERS             |
//+-----------------------------------------+
input uint                CCIPeriod=14;             // indicator period
input ENUM_APPLIED_VOLUME VolumeType=VOLUME_TICK;   // volume
input int                 HighLevel=+50;            // overbought level
input int                 LowLevel=-50;             // oversold level
input uint                Gap=10;                   // unconsidered gap in points
input Smooth_Method       MA_SMethod=MODE_T3;       // Averaging method
input uint                MA_Length=12;             // Smoothing depth
input int                 MA_Phase=15;              // parameter of the first smoothing,
//---- for JJMA within the range of -100 ... +100, it influences the quality of the transition process;
//---- for VIDIA it is a CMO period, for AMA it is a slow average period
input int                 Shift=0;                  // Horizontal indicator shift in bars
The indicator uses SmoothAlgorithms.mqh library classes (copy it to <terminal_data_folder>\MQL5\Include). The use of the classes was thoroughly described in the article "Averaging Price Series for Intermediate Calculations Without Using Additional Buffers".

Fig. 1. XССI_Candle_Vol
MetaQuotes Ltd에서 러시아어로 번역함.
원본 코드: https://www.mql5.com/ru/code/21922
 XRSI_Candle_Vol
RSI_Candle_Vol indicator with additional averaging of the resulting candles
 FlatTrend
Flat/trend indicator.
 XCCI_Histogram_Vol_Direct
XCCI_Histogram_Vol indicator shows direction of the histogram bars movement using colored icons on these bars
 RenkoChart
Renko charts on custom symbols