당사 팬 페이지에 가입하십시오
- 조회수:
- 3680
- 평가:
- 게시됨:
- 2018.10.25 16:13
-
이 코드를 기반으로 한 로봇이나 지표가 필요하신가요? 프리랜스로 주문하세요 프리랜스로 이동
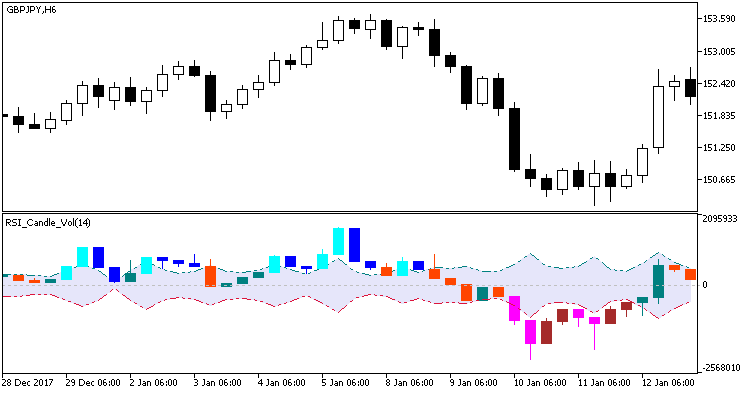
RSI_Histogram_Vol indicator in the candlestick form. Candlesticks appear as a result of relevant price timeseries processed by the indicator algorithm. In many situations, such approach may be more informative for the purpose of analysis.
In this version of the indicator, it is more reasonable to apply only one overbought and oversold level. The channel formed between these levels is colored lavender-blue and all candles closed inside this channel are colored classic green and red colors depending on the direction of the candle. Candles closed outside the channel are either aquamarine-blue or pink-brown, depending on their direction to the channel.
//+-----------------------------------------+
//|  INDICATOR INPUT PARAMETERS             |
//+-----------------------------------------+
input uint                RSIPeriod=14;             // indicator period
input ENUM_APPLIED_VOLUME VolumeType=VOLUME_TICK;   // volume
input int                 HighLevel=+15;            // overbought level
input int                 LowLevel=-15;             // oversold level
input uint                Gap=10;                   // unconsidered gap in points
input int                 Shift=0;                  // Horizontal indicator shift in bars

Fig. 1. RSI_Candle_Vol
MetaQuotes Ltd에서 러시아어로 번역함.
원본 코드: https://www.mql5.com/ru/code/21914
 CCI_Candle_Vol
CCI_Histogram_Vol indicator in the candlestick form
 XRSI_Histogram_Vol_Direct
XRSI_Histogram_Vol indicator shows direction of the histogram bars movement using colored icons on these bars
 Iin_MA_Signal_Alert
Iin_MA_Signal semaphore signal indicator features alerts, emails and push notifications
 StepMA_3D_v3_HTF
The StepMA_3D_v3 indicator with the timeframe selection option available in the indicator input parameters