당사 팬 페이지에 가입하십시오
- 조회수:
- 5246
- 평가:
- 게시됨:
- 2018.07.13 15:15
- 업데이트됨:
- 2018.08.30 13:03
-
 이 코드를 기반으로 한 로봇이나 지표가 필요하신가요? 프리랜스로 주문하세요
프리랜스로 이동
이 코드를 기반으로 한 로봇이나 지표가 필요하신가요? 프리랜스로 주문하세요
프리랜스로 이동
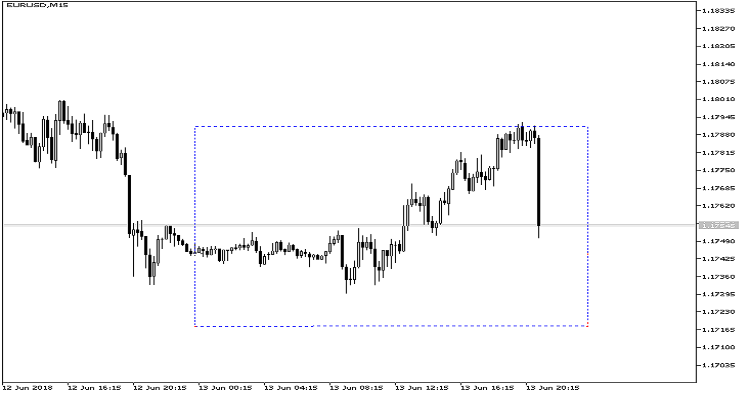
This indicator calculates the price motion potential and shows the trader price levels, at which the price loses its strength or just becomes weaker.
This information allows you to see whether it would be reasonable to trade and whether the currency is strong enough to move on, as well as helps you identify the levels, within which it would be reasonable to place your own Stop Loss and Take Profit levels.
The light version draws blue rectangles. The upper level of the rectangle is the upper level of the price strength; if this level is reached, price weakening is highly probable. Fur buy positions, it is better to place Take Profit below the upper level. For sell positions, you'd better place Stop Loss above that level.
Benefits:
- There are Full Versions for MetaTrader 4 and MetaTrader 5
- Easy to install
- Easy to read its indications
- Simple and suitable for both newbies and experienced traders
- Work on any timeframes
- Works with any financial instruments, such as Forex, CFD, BitCoin, Metals, and CryptoCurrency
- There are no excessive, distractive elements - the indicator performs its task accurately and shows potential price movements
This is a light, mostly demo version of indicator VR Atr Pro available in the Market
MetaQuotes Ltd에서 러시아어로 번역함.
원본 코드: https://www.mql5.com/ru/code/21149
 Candle shadows v1
Candlestick size and shadow analysis. In OnTradeTransaction, opening (DEAL_ENTRY_IN) and closing (DEAL_ENTRY_OUT) the positions are intercepted, as well as closing by Stop loss (DEAL_REASON_SL).
Area MACD
An unorthodox approach to indicator MACD: The EA calculates the indicator's area displayed above and below zero line.
 Ang_Zad_C_Hist_Candle
A candlestick-based chart based on histograms Ang_Zad_C_Hist calculated on the Open, High, Low, and Close timeseries of the price chart.
SymbolX
This indicator calculates the index of a given currency, using the USD index. The Close prices of six currency pairs are used to calculate the index.