당사 팬 페이지에 가입하십시오
- 조회수:
- 5604
- 평가:
- 게시됨:
- 2018.06.19 16:20
-
 이 코드를 기반으로 한 로봇이나 지표가 필요하신가요? 프리랜스로 주문하세요
프리랜스로 이동
이 코드를 기반으로 한 로봇이나 지표가 필요하신가요? 프리랜스로 주문하세요
프리랜스로 이동
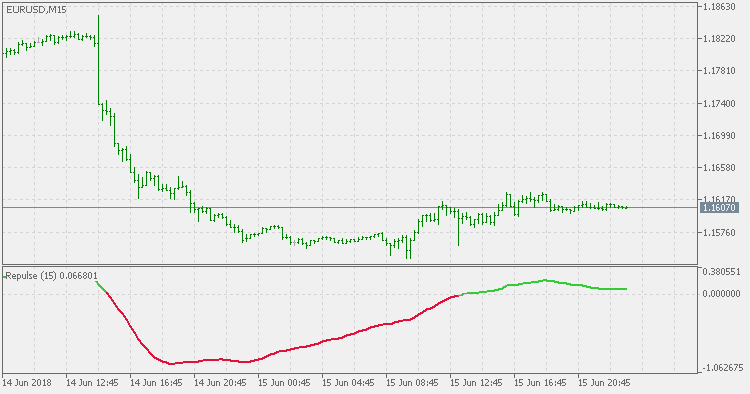
The Repulse indicator measures and displays the bullish or bearish pressure associated with each price candlestick in the form of a curve.
There is only one parameter: the repulse period. Indicator is internally using all 4 prices in calculations and that is the reason why the price can not be changed in calculation. Recommended usage is simple:
- Crossing the zero line up can be treated as buy signal.
- Crossing the zero line up can be treated as sell signal.
 Log Sigmoidal Normalized T3
In this indicator T3 is sigmoidal (Softmax) normalized - made as oscillator that ranges in 0 to 1 range, and if you use hyperbolic normalization it will range from -1 to +1 range.
RSI with RSI
The five-week and 17-week RSI values are used for entry and exits while the 17-week RSI is used for trend direction as an entry filter in the retracement entries.
Log Sigmoidal Normalized Jurik MA
In this indicator Jurik MA is sigmoidal (Softmax) normalized - made as oscillator that ranges in 0 to 1 range, and if you use hyperbolic normalization it will range from -1 to +1 range.
Repulse Multi Timeframe
The Repulse Multi Timeframe indicator measures and displays the bullish or bearish pressure associated with each price candlestick in the form of a curve.