당사 팬 페이지에 가입하십시오
- 조회수:
- 3012
- 평가:
- 게시됨:
- 2018.07.09 13:37
- 업데이트됨:
- 2023.03.29 13:48
-
이 코드를 기반으로 한 로봇이나 지표가 필요하신가요? 프리랜스로 주문하세요 프리랜스로 이동
Synthetic Japanese candlesticks over the period predefined in the indicator settings, calculating on each bar, averaging the price timeseries used in the indicator, and highlighting caudate candlesticks.
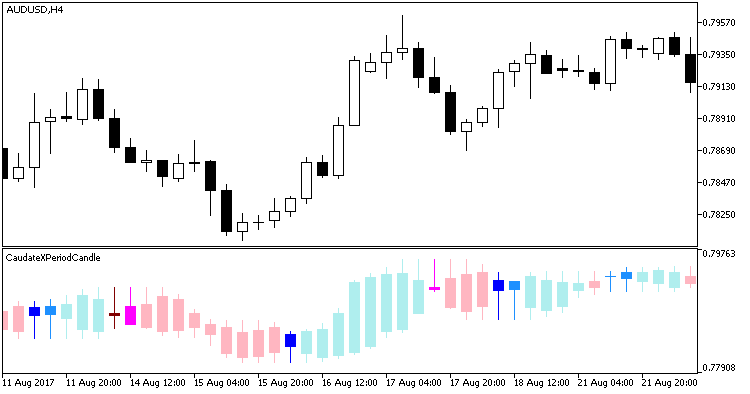
Normal candlesticks are colored as pale as possible. The indicator highlights caudate candlesticks of the "hammer" or "inverted hammer" type, the body of such candlestick being in the upper or lower half of the candlestick. Hammer-formed candlesticks are highlighted in blue, while the "inverted hammers" are highlighted in red. Candles are highlighted in a bright color, if its tail and the close price are located on different sides of the candlestick. If the tail and the price are on the same side, the candlesticks are highlighted in a less bright color.
The indicator uses the SmoothAlgorithms.mqh library classes (copy it to terminal_data_directory\MQL5\Include), working with which was described in details published in article Averaging Price Series for Intermediate Calculations without Using Additional Buffers.

Fig 1. Indicator CaudateXPeriodCandle
MetaQuotes Ltd에서 러시아어로 번역함.
원본 코드: https://www.mql5.com/ru/code/21083
 XPeriodCandle
Synthetic Japanese candlesticks over the period predefined in the indicator settings, calculating on each bar and averaging the price timeseries used in the indicator.
 PeriodCandle
Synthetic Japanese candlesticks over the period defined in the indicator settings, calculating on each bar.
 CaudateXPeriodCandleRange
An indicator that draws the CaudateXPeriodCandle candlestick sizes in points.
 CaudateXPeriodCandle_main
Indicator CaudateXPeriodCandle in the main chart