당사 팬 페이지에 가입하십시오
- 조회수:
- 5010
- 평가:
- 게시됨:
- 2018.06.14 13:35
-
 이 코드를 기반으로 한 로봇이나 지표가 필요하신가요? 프리랜스로 주문하세요
프리랜스로 이동
이 코드를 기반으로 한 로봇이나 지표가 필요하신가요? 프리랜스로 주문하세요
프리랜스로 이동
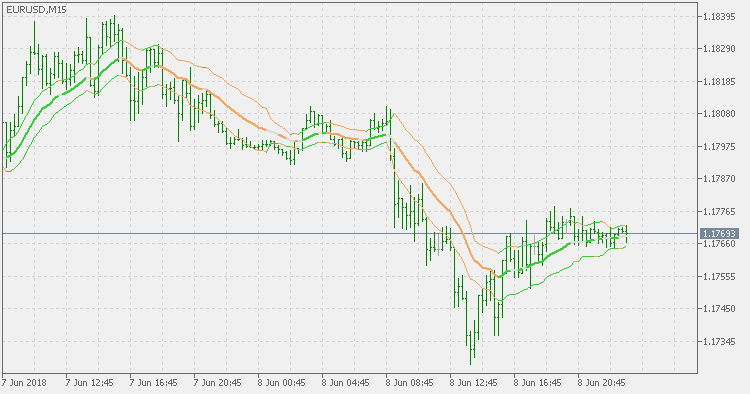
Historical Volatility bands that are constructed using:
- Average as the middle line.
- Upper and lower bands using the Historical Volatility high/low (instead of "regular" Historical Volatility) for bands calculation.
Color of the middle line, unlike the bands colors, has 3 colors. When colors of the bands are the same, then the middle line is having the same color, otherwise it is having a neutral color.
 RSI Сandles - Smoothed with Trend Envelopes
RSI Candles with an additional option to filter (smooth) the prices prior to using them in RSI calculation (which, effectively makes it an RSI of average).
Historical Volatility Bands
Historical Volatility Bands constructed using average as the middle line, and upper and lower bands using the Historical Volatility for bands calculation.
Quadratic Regression MA
Quadratic Regression MA is a sort of a linear regression value variation, but faster in response to market changes.
LSMA Trend
Indicator based on LSMA (Least Squares Moving Average). It shows the trend of the used average and displays it as a sort of an oscillator.