당사 팬 페이지에 가입하십시오
- 조회수:
- 4682
- 평가:
- 게시됨:
- 2018.06.15 10:33
-
 이 코드를 기반으로 한 로봇이나 지표가 필요하신가요? 프리랜스로 주문하세요
프리랜스로 이동
이 코드를 기반으로 한 로봇이나 지표가 필요하신가요? 프리랜스로 주문하세요
프리랜스로 이동
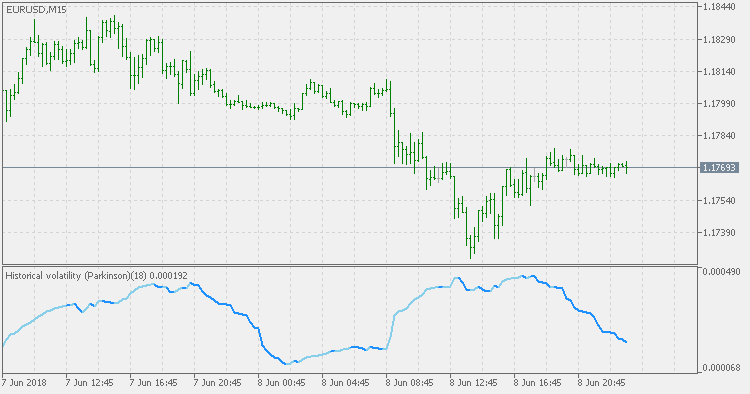
The Parkinson's number, or High Low Range Volatility developed by the physicist, Michael Parkinson in 1980, aims to estimate the Volatility of returns for a random walk using the High and Low in any particular period. IVolatility.com calculates daily Parkinson values. Prices are observed on a fixed time interval: n = 10, 20, 30, 60, 90, 120, 150, 180 days.
- SH is stock's High price in t day.
- SL is stock's Low price in t day.
- High/Low Return (xtHL) is calculated as the natural logarithm of the ratio of a stock's High price to stock's Low price.
- Return:

- And Parkinson's number:
An important use of the Parkinson's number is the assessment of the distribution prices during the day as well as a better understanding of the market dynamics. Comparing the Parkinson's number and periodically sampled volatility helps traders understand the tendency towards mean reversion in the market as well as the distribution of stop-losses.
 Trend Envelopes of Averages
Trend Envelopes with an option to chose smoothed/filtered price in calculation instead of using "raw" prices.
LSMA Trend
Indicator based on LSMA (Least Squares Moving Average). It shows the trend of the used average and displays it as a sort of an oscillator.
Historical Volatility Bands - Parkinson
Historical Volatility Bands that are constructed using average as the middle line, and upper and lower bands using the Parkinson's historical volatility (instead of "regular" Historical Volatility) for bands calculation.
 PivotHeiken 3
The EA uses indicators Pivot-2 and Heiken Ashi Smoothed Oscillator.