당사 팬 페이지에 가입하십시오
- 조회수:
- 6245
- 평가:
- 게시됨:
- 2018.06.14 13:04
- 업데이트됨:
- 2018.06.14 13:05
-
 이 코드를 기반으로 한 로봇이나 지표가 필요하신가요? 프리랜스로 주문하세요
프리랜스로 이동
이 코드를 기반으로 한 로봇이나 지표가 필요하신가요? 프리랜스로 주문하세요
프리랜스로 이동
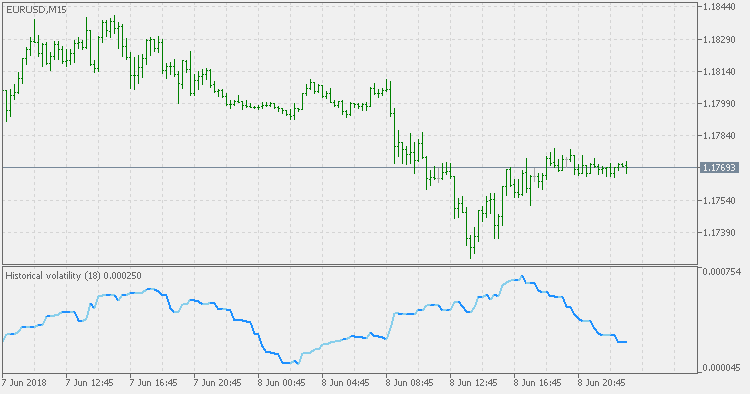
Historical Volatility (HV) is a statistical measure of the dispersion of returns for a given security or market index over a given period of time. Generally, this measure is calculated by determining the average deviation from the average price of a financial instrument in the given time period. Using standard deviation is the most common, but not the only, way to calculate Historical Volatility.
The higher the Historical Volatility value, the riskier the security. However, that is not necessarily a bad result as risk works both ways - bullish and bearish, i.e: Historical Volatility is not a directional indicator and should not be used as other directional indicators are used. Use to to determine the rising and falling price change volatility.
 BB Stops - Smoothed WPR
BB Stops indicator of smoothed WPR.
BB Stops - RSI
BB Stops using RSI for stops calculation.
Historical Volatility - High/Low
This version also does not use Close prices for volatility calculation. Instead it uses the High/Low ratio (the calculation is different from the "regular" Historical Volatility indicator).
Historical Volatility Bands
Historical Volatility Bands constructed using average as the middle line, and upper and lower bands using the Historical Volatility for bands calculation.