당사 팬 페이지에 가입하십시오
- 조회수:
- 7378
- 평가:
- 게시됨:
- 2018.06.16 11:09
-
이 코드를 기반으로 한 로봇이나 지표가 필요하신가요? 프리랜스로 주문하세요 프리랜스로 이동
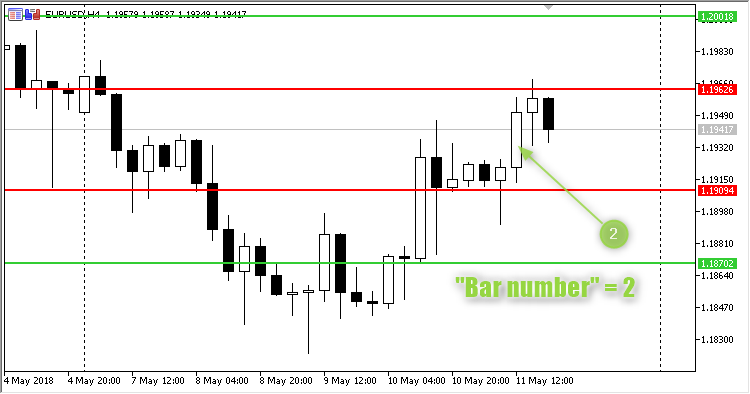
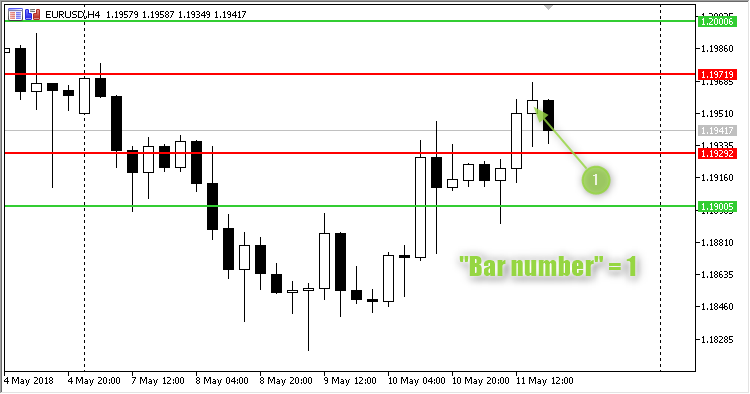
The indicator plots four horizontal lines: Two basic ones (red by default) above the High and below the Low of the Bar number bar and help lines (green by default) shifted from the basic ones.
Basic lines plotting rule
- Line HighLowUP is plotted by the High of the Bar number plus Shift;
- Line HighLowDOWN is plotted by the Low of the Bar number minus Shift.
Help lines plotting rule
-
Line DifferenceUP is plotted by the HighLowUP price PLUS the difference between prices HighLowUP and HighLowDOWN and MINUS Shift.
-
Line DifferenceDOWN is plotted by the HighLowDOWN price MINUS the difference between prices HighLowUP and HighLowDOWN and PLUS Shift.
This indicator is mostly used on large timeframes, starting from H4.

Fig. 1. Parameter "Bar number" is "2"

Fig. 2. Parameter "Bar number" is "1"
MetaQuotes Ltd에서 러시아어로 번역함.
원본 코드: https://www.mql5.com/ru/code/20724
 TST
TST
The Expert Advisor does not use any indicators. It only uses the current price and the OHLC of zero bar.
 EMAVFS_StDev
The EMAVFS indicator with additional trend strength indication using colored dots based on the standard deviation algorithm.
 EMAVFS_StDev_HTF
Indicator EMAVFS_StDev with the timeframe selection option available in input parameters.
 Exp_2XMA_Ichimoku_Oscillator
A trading system based on the 2XMA_Ichimoku_Oscilator indicator signals.