거래 로봇을 무료로 다운로드 하는 법을 시청해보세요
당사를 Telegram에서 찾아주십시오!
당사 팬 페이지에 가입하십시오
당사 팬 페이지에 가입하십시오
스크립트가 마음에 드시나요? MetaTrader 5 터미널에서 시도해보십시오
- 조회수:
- 8042
- 평가:
- 게시됨:
- 업데이트됨:
-
이 코드를 기반으로 한 로봇이나 지표가 필요하신가요? 프리랜스로 주문하세요 프리랜스로 이동
Real author:
Pedro Puado
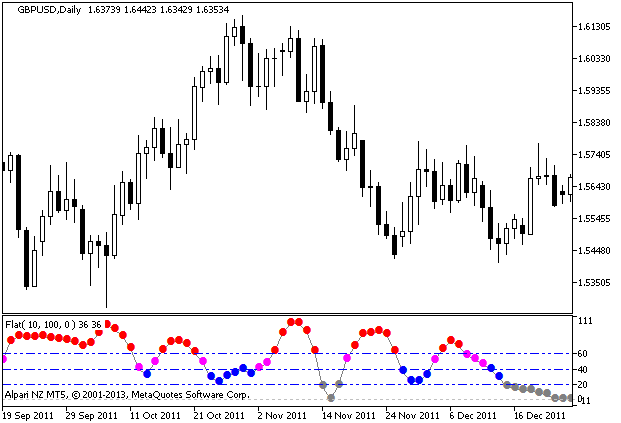
The indicator for measuring market volatility.
During strong trends colored dots of the indicator turn red, during weak trends dots are gray. Moderate trends are shown in blue.
Indicator input parameters:
//+----------------------------------------------+
//| Indicator input parameters                   |
//+----------------------------------------------+
input uint Smooth=10;                                // Smoothing period
input ENUM_MA_METHOD      ma_method=MODE_SMA;        // Type of smoothing
input ENUM_APPLIED_PRICE  applied_price=PRICE_CLOSE; // Price type
input uint HLRef=100;
input int Shift=0;                                   // Horizontal shift of the indicator in bars
input uint ExtraHighLevel=60;                        // The level of the strongest trend
input uint HighLevel=40;                             // The level of a strong trend
input uint LowLevel=20;                              // The level of a weak trend
input ENUM_LINE_STYLE LevelStyle=STYLE_DASHDOTDOT;   // Style of level lines
input color LevelColor=clrBlue;                      // Color of the levels
input ENUM_WIDTH LevelWidth=w_1;                     // Width of the levels
Originally this indicator has been written in MQL4 and was first published in the Code Base at mql4.com on 01.11.2007.

Figure 1. The Flat indicator
MetaQuotes Ltd에서 러시아어로 번역함.
원본 코드: https://www.mql5.com/ru/code/2060
 WPR_3HTF
Three Larry Williams' Percent Range indicators from three different timeframes displayed on the same chart.
 Fisher_mbk_HTF
The Fisher_mbk indicator with the timeframe selection option available in input parameters.