당사 팬 페이지에 가입하십시오
- 조회수:
- 7969
- 평가:
- 게시됨:
- 2018.04.27 12:11
-
 이 코드를 기반으로 한 로봇이나 지표가 필요하신가요? 프리랜스로 주문하세요
프리랜스로 이동
이 코드를 기반으로 한 로봇이나 지표가 필요하신가요? 프리랜스로 주문하세요
프리랜스로 이동
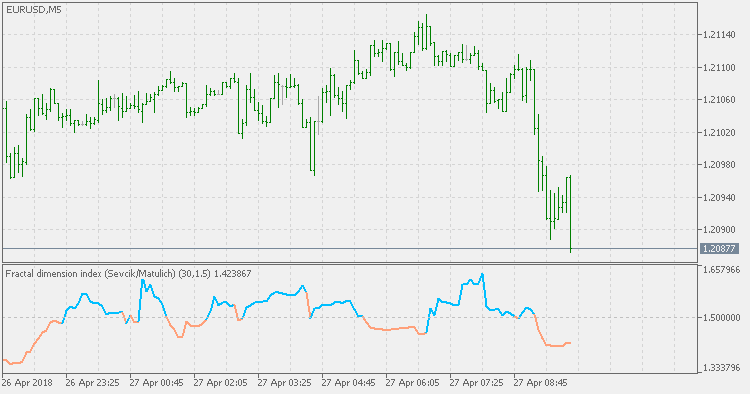
According to the description of Fractal Dimension Index:
Mandelbrot describes the Fractal Dimension Index (FDI) as a way to measure "how convoluted and irregular" something is. The FDI can be used as a stock market indicator.
We can look at prices in a market as "trending" or "ranging". During a strong rally, prices trend sharply, sometimes approaching a one-dimensional straight line. And if we believe that prices should move in a more jagged fractal pattern, we would assume that the almost-straight movement will end at a point which we might be able to predict with a degree of accuracy sufficient to make a good trade.
After trending, prices often trade in a range for a while before embarking upon the next trend. Imagine prices trading in a rectangular pattern, zigzagging back-and-forth over the same points in a two-dimensional planar pattern. A plane isn't a fractal any more than is a straight line, so we might expect prices to break out of the range and get back to acting like a fractal.
And so, the FDI is a method which assigns a number to the line on your chart. The number will be between 1.0 and 2.0. The closer prices move in a one-dimensional straight line, the closer the FDI moves to 1.0. The more closely prices resemble a two-dimensional plane, the closer the FDI moves to 2.0.
This version is made exactly as described by the original inventor of FDI (Carlos Sevcik) with one correction: the formula that Sevcik published is inverted. The error was corrected by Alex Matulich and this version is using the correct calculation.
 Fractal dimension - Ehlers
By it's nature, fractal dimension index indicator is not directional. Instead it is showing if there is a trend or not. If the value of the FDI is less than the target threshold, then there is no trend (the market is ranging). If the value is above that threshold then the market is trending.
BB MACD Extended
BB MACD is a MACD (Moving Average Convergence Divergence) indicator variation with an addition of Bollinger Bands, which helps in detecting trend change points and measuring current trend's strength.
Fractal Dimension - Jurik
Fractal Dimension from Mark Jurik is much smoother than the others but the general rule is the same: it is not a directional indicator, but is attempting to determine if there is a trend in the current market price changes or not, and it should be used bearing that in mind.
Hurst Exponent
The Hurst exponent is referred to as the "index of dependence" or "index of long-range dependence". It quantifies the relative tendency of a time series either to regress strongly to the mean or to cluster in a direction.