당사 팬 페이지에 가입하십시오
- 게시자:
- Vladimir Karputov
- 조회수:
- 3316
- 평가:
- 게시됨:
- 2018.06.06 14:40
-
이 코드를 기반으로 한 로봇이나 지표가 필요하신가요? 프리랜스로 주문하세요 프리랜스로 이동
The author of the idea: MaxBau.
The MQL5 code author: Vladimir Karputov.
The Expert Advisor compares the values of five Moving Averages (with period 10, 20, 50, 100 and 200). When the lines of all five indicators get arranged one above the other:
- MA(10) > MA(20) > MA(50) > MA(100) > MA(200) - we have a signal to open a BUY position,
if the indicators are one under the other:
- MA(10) < MA(20) < MA(50) < MA(100) < MA(200) - we have a signal to open a SELL position.
The value of the ADX indicator is additionally checked: if ADX is below 20, BUY and SELL opening signals are ignored.
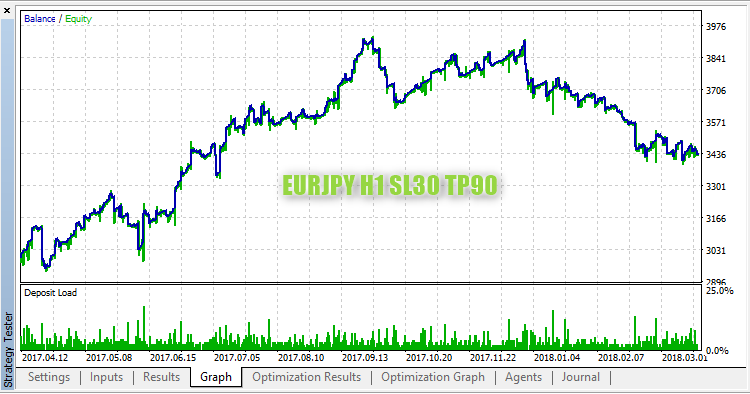
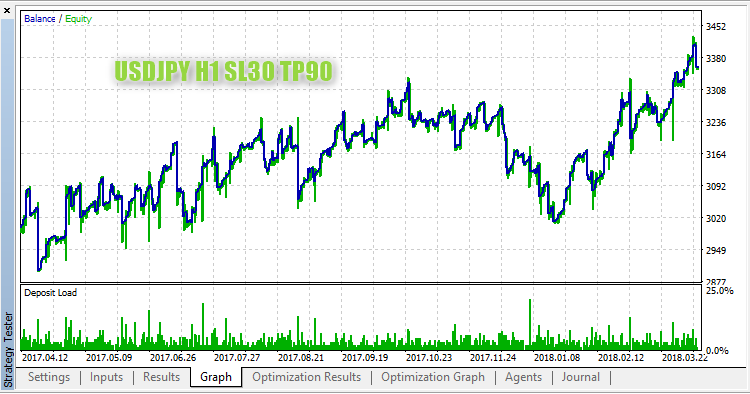
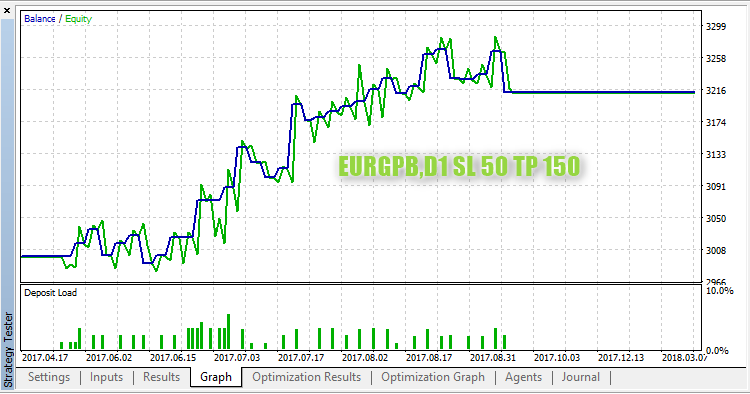
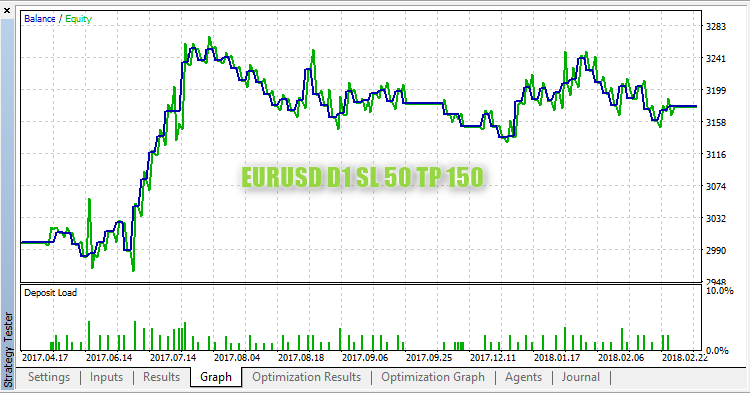
The EA has been tested in the "Every Tick" mode on two timeframes: H1 and D1. The following settings were used on H1: Stop Loss = 30, TakeProfit = 90. Settings on D1: Stop Loss = 50, TakeProfit = 150.
EURJPY,H1 StopLoss 30 TakeProfit 90:

USDJPY,H1 StopLoss 30 TakeProfit 90:

EURGPB,D1 StopLoss 50 TakeProfit 150:

EURUSD,D1 StopLoss 50 TakeProfit 150:

MetaQuotes Ltd에서 러시아어로 번역함.
원본 코드: https://www.mql5.com/ru/code/20492
 Poker_SHOW
An Expert Advisor based on a random number generator. Trend is determined using the iMA (Moving Average, MA) indicator.
 sDotToLineDist
A script calculating the distance between a point and a line.
 EMA_WMA v2
EMA_WMA - Expert Advisor for MetaTrader 5. Intersection of two iMA (MA). Position trailing.
 Advanced ADX
This version of ADX instead uses different display in order to make that as easy as it can be. The ADX values are easily comparable to the significant level, the the color of the ADX value and histogram clearly shows the trend. That way it is easier to follow the ADX trend(s) and values.