당사 팬 페이지에 가입하십시오
- 조회수:
- 5033
- 평가:
- 게시됨:
- 2018.02.26 09:37
-
 이 코드를 기반으로 한 로봇이나 지표가 필요하신가요? 프리랜스로 주문하세요
프리랜스로 이동
이 코드를 기반으로 한 로봇이나 지표가 필요하신가요? 프리랜스로 주문하세요
프리랜스로 이동
Balance of Power, introduced by Igor Livshin attempts to measure the strength of buyers vs. sellers by assessing the ability of each to push price to an extreme level. Livshin published this indicator in the August 2001 issue of Stocks and Commodities Magazine. This version of indicator calculates the BOP exactly as it is described in the article where it was published.
The resulting raw BOP values can be optionally smoothed using any Moving Average type.
The BOP oscillates between extremes of -1 and +1.
But the "raw" BoMP would be almost unusable in trading. Example of such a value can be checked if you set the smoothing period to <=1 - like this :
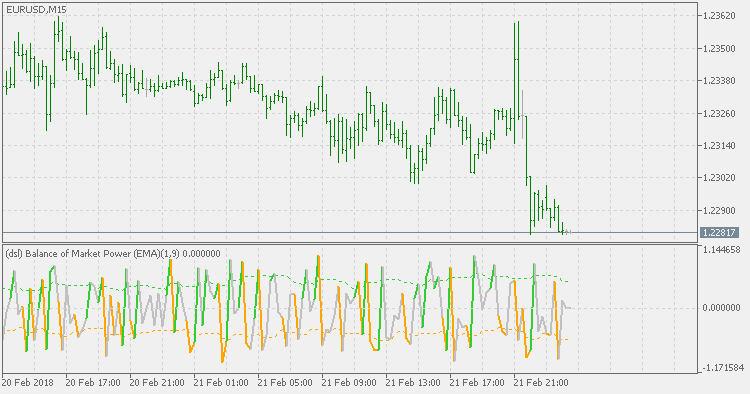
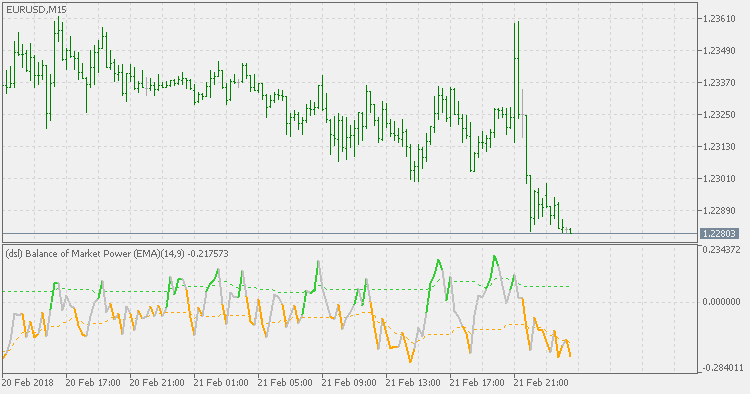
That makes it almost impossible to be used for trading decision. That is the main reason why the inventor of that indicator already at the start added result smoothing. Default used is the default proposed by Igor Livshin (period 14), but that is, as usually, a subject of experimenting too. In any case, smoothed value is much better for trading decisions, and combined with DSL (Discontinued Signal Line) it can be used both for trending and scalping mode.
 Chaos zone
Chaos zone indicator that is a combination of two Bill Williams' indicators: Accelerator Oscillator and Awesome Oscillator.
EMA levels
Instead of being in a hurry to follow the price with the stop loss, this indicator is adjusting a proposed stop loss only when it notices a trend change in the opposite direction. That way, it keeps the level intact while trending, and adjusts it when it "sees" that there is a possible trend change) and gives bigger "room" for an order to survive possible whipsaws in trends. Also, since it is estimating a trend, this indicator displays the periods when there is a trend in different color(s) in order to make it easier to decided what to do.
Fractals Chaos Oscillator
A different way of looking at the fractals: instead of showing fractals the usual way, this indicator shows fractals as an oscillator and can show the "rhythm" of the changes in the market.
T3 levels
T3 is very similar to EMA in calculating way and it makes it suitable for this way of calculation. As an extension of EMA levels it might prove to be useful but by all means do some experimenting in order to get the best results for specific symbol/timeframe combination.