당사 팬 페이지에 가입하십시오
- 조회수:
- 9552
- 평가:
- 게시됨:
- 2018.02.26 09:43
-
 이 코드를 기반으로 한 로봇이나 지표가 필요하신가요? 프리랜스로 주문하세요
프리랜스로 이동
이 코드를 기반으로 한 로봇이나 지표가 필요하신가요? 프리랜스로 주문하세요
프리랜스로 이동
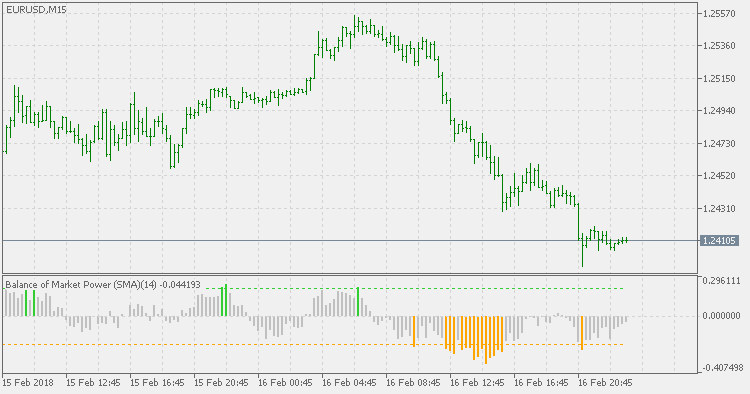
Balance of Power, introduced by Igor Livshin, attempts to measure the strength of buyers vs. sellers by assessing the ability of each to push price to an extreme level. Livshin published this indicator in the August 2001 issue of Stocks and Commodities Magazine. This version of indicator calculates the BOP exactly as it is described in the article where it was published.
The resulting raw BOP values can be optionally smoothed using any Moving Average type.
The BOP oscillates between extremes of -1 and +1.
Livshin makes the following statements:
- For daily charts, a 14-period Moving Average is recommended, though the number of periods varies depending on the nature of the market and the time frame.
- One of the most important properties of BOP is the level at which it clusters its tops and bottoms. During bull markets, its tops often reach the upper limit and never reach the bottom level. During bear markets, the picture is reversed.
- BOP supports price divergence, trends, and overbought-oversold levels.
- A change in the BOP trend serves as a warning signal and should be confirmed by a change in the price direction.
 T3 levels
T3 is very similar to EMA in calculating way and it makes it suitable for this way of calculation. As an extension of EMA levels it might prove to be useful but by all means do some experimenting in order to get the best results for specific symbol/timeframe combination.
Fractals Chaos Oscillator
A different way of looking at the fractals: instead of showing fractals the usual way, this indicator shows fractals as an oscillator and can show the "rhythm" of the changes in the market.
Stochastic DeMarker
This version of DeMarker indicator uses the "help" of smoothed Stochastic to emphasize the states of DeMarker and to help in easier trend assessment.
Instantaneous Trend Line
Instantaneous Trend Line is one of the series of indicators created by John Ehlres.