당사 팬 페이지에 가입하십시오
- 조회수:
- 4109
- 평가:
- 게시됨:
- 2018.02.21 15:10
-
이 코드를 기반으로 한 로봇이나 지표가 필요하신가요? 프리랜스로 주문하세요 프리랜스로 이동
The Stochastic Oscillator is a Momentum indicator comparing the closing price of a security to the range of its prices over a certain period of time. The sensitivity of the oscillator to market movements is reducible by adjusting that time period or by taking a Moving Average of the result.
The general theory serving as the foundation for this indicator is that in a market trending upward, prices will close near the high, and in a market trending downward, prices close near the low. Transaction signals are created when the %K crosses through a three-period Moving Average, which is called the %D.
The usual average that is used for stochastic calculation is simple Moving Average (SMA). This (extended) version allows you to use any of the 4 basic types of averages (default is SMA, but you can use EMA, SMMA or LWMA too) - some are "faster" then the default version (like EMA and LWMA versions) and SMMA is a bit "slower", but this way you can fine tune the "speed" to signals ratio.
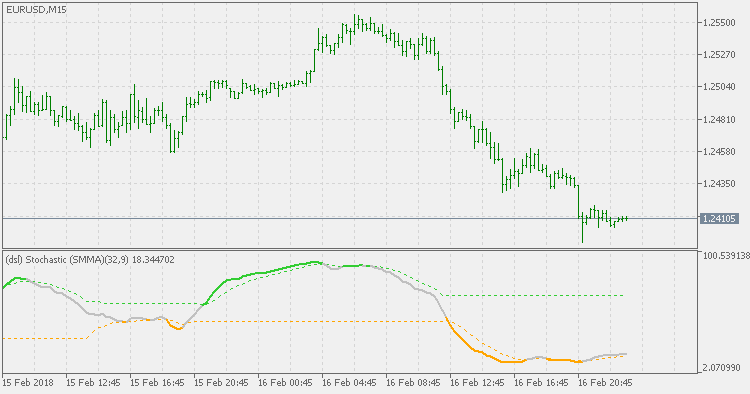
The DSL (Discontinued Signal Line) version of Stochastic does not use a Moving Average in a classical way for signals, but is instead calculating the signal lines depending on the value(s) of the stochastic. Thus, we are having two things: a signal line and a sort of levels that can be used for overbought and oversold estimation.

 DSL - stochastic
The DSL (Discontinued Signal Line) version of Stochastic does not use a moving average in a classical way for signals, but is instead calculating the signal lines depending on the value(s) of the stochastic. Thus, we are having two things : a signal line and a sort of levels that can be used for overbought and oversold estimation.
 DSL - WPR
The DSL version of Williams' Percent Range does not use fixed levels for oversold and overbought levels, but is having a sort of dynamic (discontinued signal lines) calculated to identify those levels. That makes it a bit more responsive to market changes and volatile markets.
 EMA levels
Instead of being in a hurry to follow the price with the stop loss, this indicator is adjusting a proposed stop loss only when it notices a trend change in the opposite direction. That way, it keeps the level intact while trending, and adjusts it when it "sees" that there is a possible trend change) and gives bigger "room" for an order to survive possible whipsaws in trends. Also, since it is estimating a trend, this indicator displays the periods when there is a trend in different color(s) in order to make it easier to decided what to do.
 Chaos zone
Chaos zone indicator that is a combination of two Bill Williams' indicators: Accelerator Oscillator and Awesome Oscillator.