당사 팬 페이지에 가입하십시오
- 게시자:
- Maxim Dmitrievsky
- 조회수:
- 9013
- 평가:
- 게시됨:
- 2018.03.01 09:28
-
이 코드를 기반으로 한 로봇이나 지표가 필요하신가요? 프리랜스로 주문하세요 프리랜스로 이동
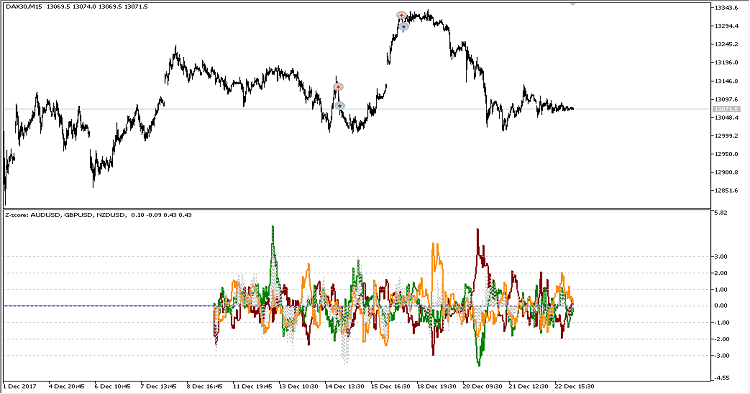
The indicator finds linear regression coefficients between each of the selected symbols and all other symbols, and displays them in the form of standard deviations. The sum of all the curves is displayed as a gray dashed histogram, which shows the deviation of the model portfolio from its real value. It can be used for experimenting with manual or automated pair trading.
Input Parameters
- learning_depth - the calculation period in bars;
- SymbolsList - required symbols separated by commas.

MetaQuotes Ltd에서 러시아어로 번역함.
원본 코드: https://www.mql5.com/ru/code/19630
 RMI_Histogram
Relative Momentum Index implemented as a color histogram with an indication of overbought and oversold zones.
 Exp_XFatlXSatlCloud_Duplex
Two identical trading systems based on the change in the color of XFatlXSatlCloud for long and short trades, which can be configured in different ways in one Expert Advisor.
 ColorSRoC
The smoothed S-RoC indicator of the relative price increment by Fred Shutsman.
 JS_SISTEM_2
The Expert Advisor uses three iMAs (Moving Average, MA), one iOsMA (Moving Average of Oscillator and one iRVI (Relative Vigor Index, RVI). Trailing stop is based on the High/Low of earlier bars.