당사 팬 페이지에 가입하십시오
- 조회수:
- 9168
- 평가:
- 게시됨:
- 2013.10.18 17:55
- 업데이트됨:
- 2016.11.22 07:32
-
이 코드를 기반으로 한 로봇이나 지표가 필요하신가요? 프리랜스로 주문하세요 프리랜스로 이동
Real author:
Sergej Solujanov
A smooth non-normalized oscillator implemented in the form of a color histogram.
How does trend change? How to select flat? How to trade? ... etc.
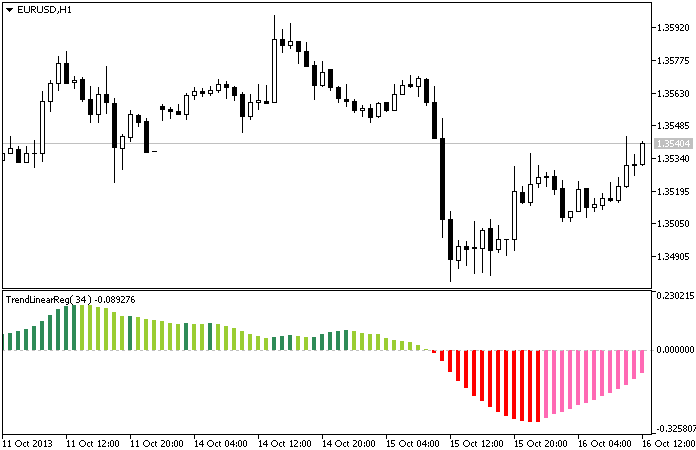
If we assume that the trend of N bars is a straight line, we can calculate the parameters of this line. Equation of the line is y = bx + c. The line slope is characterized by the "b" coefficient. The indicator calculates this parameter by linear regression for every bar and displays it in a separate window. Color green shows that the value that is greater than the previous one, i.e. the angle increases, the red means just the opposite.
In fact, in relation to charts, the "b" coefficient is derived from two factors - from the tangent of the angle line and the coefficient that characterizes the pair, so the scale of the indicator values is different for different pairs.
How to use the indicator? In my opinion, there are several options:
- Crossing the zero line;
- Touching the maximum value;
- If you set a certain area around the zero line as a flat, you can trade at the breakthrough of the zone.

Fig. 1. The TrendLinearReg indicator
MetaQuotes Ltd에서 러시아어로 번역함.
원본 코드: https://www.mql5.com/ru/code/1884
 SI
SI
A non-normalized oscillator.
 StepRSI_v5.2
A trend indicator that uses the oscillator analogue of RSI and its signal line. It is drawn as a colored cloud.
 Chande_Kroll_Stop_v1
An indicator of the trend power drawn in the form of a colored cloud.
 ChandelierStops_v1
A trend indicator implemented in the form of NRTR.