당사 팬 페이지에 가입하십시오
- 조회수:
- 38380
- 평가:
- 게시됨:
- 2013.10.07 12:11
- 업데이트됨:
- 2016.11.22 07:32
-
이 코드를 기반으로 한 로봇이나 지표가 필요하신가요? 프리랜스로 주문하세요 프리랜스로 이동
This indicator will plot divergence lines on the Awesome_Oscillator indicator and will give buy and sell signal by displaying arrows.
It also has a built-in Show_alert, Play_Sound, Send_Email & Send_Notification function. In default:
- Bullish Regular_Divergence is plotted in Blue lines & solid,
- Bullish Hidden_Divergence is plotted in Aqua lines & dotted,
- Bearish Regular_Divergence is plotted in Red lines & solid,
- Bearish Hidden_Divergence is plotted in Orange lines & dotted,
- & Indicator Divergence lines does not pass ( going across ) through the body of the Indicator/histogram.
This indicator based on description for divergence in: Signals of the Awesome Oscillator
for example in Bullish Regular_Divergence:
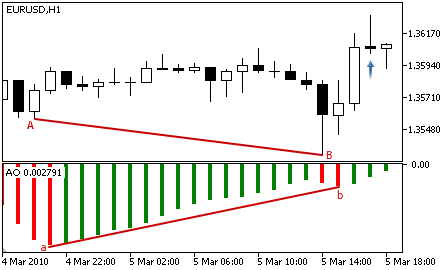
Fig. 1. Bullish Divergence example
Divergence: the first analyzed bottom of the indicator is shallower than the previous one, and the corresponding price valley is deeper than the previous one. In addition, the indicator must not rise above the zero level.
Parameters:
Inputs parameters are shown in below pic.
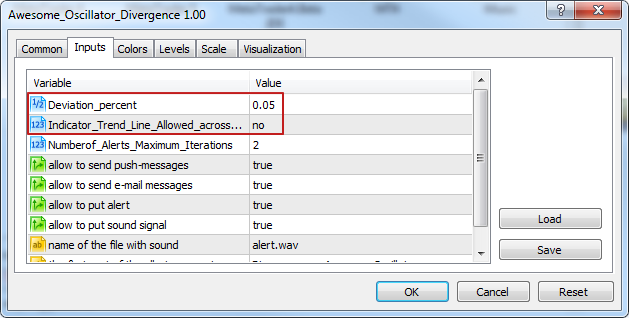
Fig. 2. Input parameters of the Awesome Oscillator Divergence indicator
Two of them are important.
1. Deviation_percent: default value is 0.05 and this is the maximum percent ratio of AO value which allowed to be out of range.
As shown in Figure below:
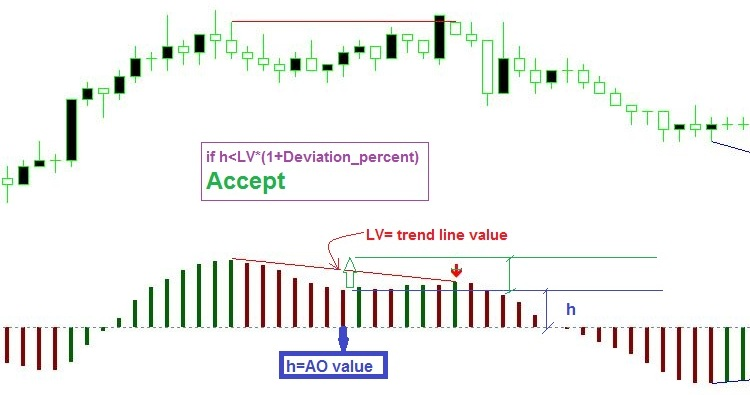
Fig. 3. Awesome Oscillator percent ratio
Obviously, with choice 0.0 there are all AO value will be within the range.
2. Indicator_Trend_Line_Allowed_across_through_the_histogram_body: default value is no.
The following screenshots are enough to show the difference in performance for different modes yes/no.
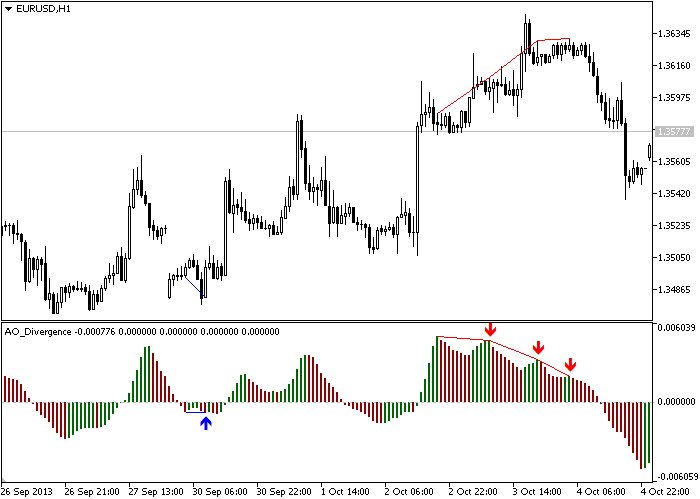
Fig. 4. Indicator_Trend_Line_Allowed_across_through_the_histogram_body=no
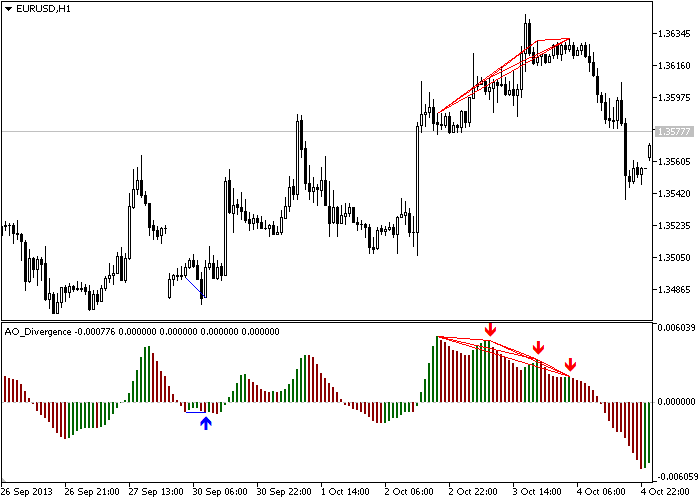
Fig. 5. Indicator_Trend_Line_Allowed_across_through_the_histogram_body=yes
 Script for Calculation of Candle Statistics
The script calculates candles statistics (the minimal, maximal and average values of candles body and shadows) of the current chart.
 Clock-Indiсator
The indicator shows the current date, time, the current spread and stop levels.
 IREA
IREA
IREA is an automated trade algorithm based on the idea of that an unusual impact in price changes will be adjusted by an inverse movement.
 MQL5 Wizard - Trading Signals of Candlestick Patterns + Stochastic
Trading signals of candlestick patterns with confirmation by Stochastic indicator.