당사 팬 페이지에 가입하십시오
- 조회수:
- 11342
- 평가:
- 게시됨:
- 2017.03.13 09:33
-
 이 코드를 기반으로 한 로봇이나 지표가 필요하신가요? 프리랜스로 주문하세요
프리랜스로 이동
이 코드를 기반으로 한 로봇이나 지표가 필요하신가요? 프리랜스로 주문하세요
프리랜스로 이동
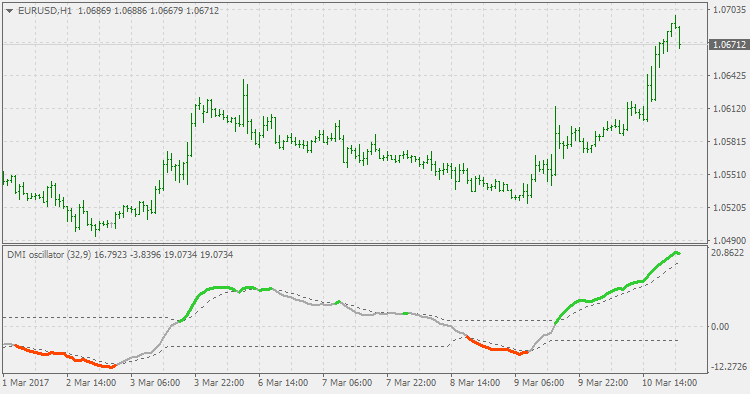
DMI short description (since it is not widely known).
Within the suite of indicators that make up Wilder’s directional movement index (DMI) are the plus directional movement indicator (+DI) and the minus directional movement indicator (-DI). They provide the foundation for the more widely recognized average directional index (ADX). Whereas the ADX offers information about the strength of price movement but not its direction, the +DI and -DI furnish information about the positive or negative direction of price movement over a period of time.
Wilder provides complete information about the function and construction of all the components that make up the directional movement index in his 1978 book, New Concepts In Technical Trading Systems. In general, the plus and minus components of the DMI focus on that portion of the current bar’s trading range that is outside the range of the previous price bar. If it is higher, it is considered to be positive (+) and if it is lower, it is labeled negative (-). These values are divided by the true range and averaged over time, usually 14 periods. A move by the +DI above the -DI indicates that positive or upward price direction has overtaken negative or downward price direction. Conversely, when +DI falls below -DI, declining price either from selling pressure or lack of upward price momentum is taking control. Potential changes in direction or trend occur when the lines intersect.
As with all the dsl indicators, it can be used both in trend and counter trend trading, but the dsl in this case can add to momentum strength estimation too.
 ADXm (vhf adaptive)
ADXm (vertical/horizontal filter adaptive).
 Bollinger Bands as Support & Resistance
Example of Buy Limit & Sell Limit pending orders with Bollinger Bands.
 BufferInspector
How many buffers does your indicator use? What's it calculating? Is it efficient? If you want to know what's going on behind the scenes, you'll now be able to.
Detrended Synthetic Price (histo)
Detrended Synthetic Price with histogram.