당사 팬 페이지에 가입하십시오
- 조회수:
- 4903
- 평가:
- 게시됨:
- 2017.03.22 16:11
- 업데이트됨:
- 2023.03.29 13:47
-
이 코드를 기반으로 한 로봇이나 지표가 필요하신가요? 프리랜스로 주문하세요 프리랜스로 이동
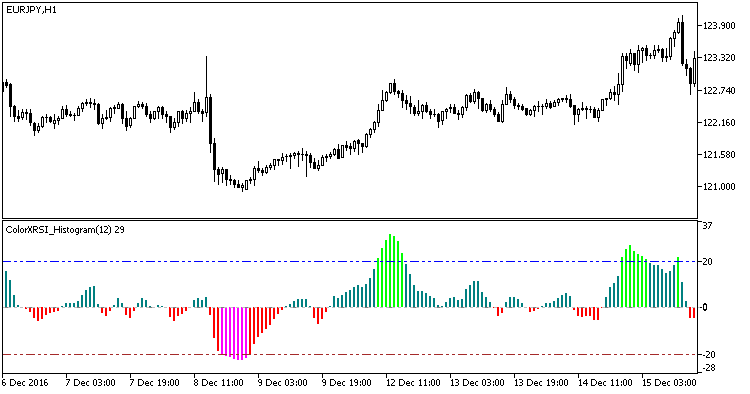
The smoothed Relative Strength Index oscillator with the color indication of overbought/oversold level breakouts and of the histogram direction. Depending on the value of the indicator's input parameter:
There are two variants of histogram coloring:
- Breakout of overbought/oversold levels;
- Change of direction.
For better histogram readability, the indicator is performed in zero relative symmetric form, and its values vary from -50 to +50.
The indicator uses SmoothAlgorithms.mqh library classes (copy it to <terminal_data_folder>\MQL5\Include). The use of the classes was described in detail in the article "Averaging Price Series for Intermediate Calculations Without Using Additional Buffers".

Fig1. The ColorXRSI_Histogram indicator
MetaQuotes Ltd에서 러시아어로 번역함.
원본 코드: https://www.mql5.com/ru/code/17631
 XCCXCandleKeltnerPluse
The XССXCandleKeltner indicator with the breakout indication option
 XRSXCandleKeltnerPluse
The XRSXCandleKeltner indicator with the breakout indication option
 ColorXWPR_Histogram
The smoothed Larry Williams' Percent Range oscillator with the color indication of overbought/oversold level breakouts and of the histogram direction.
 XOSignal
A semaphore signal indicator. Its code does not contain averaging algorithms.