거래 로봇을 무료로 다운로드 하는 법을 시청해보세요
당사를 Telegram에서 찾아주십시오!
당사 팬 페이지에 가입하십시오
당사 팬 페이지에 가입하십시오
스크립트가 마음에 드시나요? MetaTrader 5 터미널에서 시도해보십시오
- 조회수:
- 12168
- 평가:
- 게시됨:
- 업데이트됨:
-
 이 코드를 기반으로 한 로봇이나 지표가 필요하신가요? 프리랜스로 주문하세요
프리랜스로 이동
이 코드를 기반으로 한 로봇이나 지표가 필요하신가요? 프리랜스로 주문하세요
프리랜스로 이동
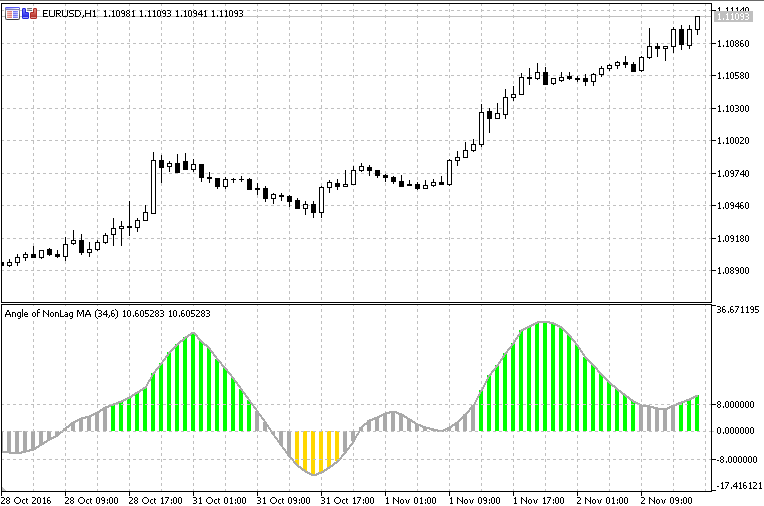
The problem that people overlook when asking to calculate an angle of
an average is simple: data on Y axes of a time series chart is
different type from the data on X axis. Since they are completely
different, the angle can not be calculated from that data. Unless you
make them the compatible. Here is one possible solution: this version "converts" time into
"pips" by using average true range as a value of a single time bar and
that way unifies the values of X and Y axis. Using the ATR for that is
an approximation (there is no 100% accurate method to do that), but it
is not a bad approximation: at least it is not showing results of >
90 degrees.
This indicator uses calculation method described above and extended to be able to calculate the rest of the 18 types of averages. So that all the usual types are covered with this version.
 Absolute Strength Averages
Absolute strength of averages. It is upgraded to use the possible 18 types of averages in calculation.
Aroon Oscillator Line
Simple visualization of Aroon oscillator.
Rapid RSI
Rapid RSI with adaptive T3 price pre-filtering
T3 Std Adaptive
The T3 using standard deviations to make it adaptive