당사 팬 페이지에 가입하십시오
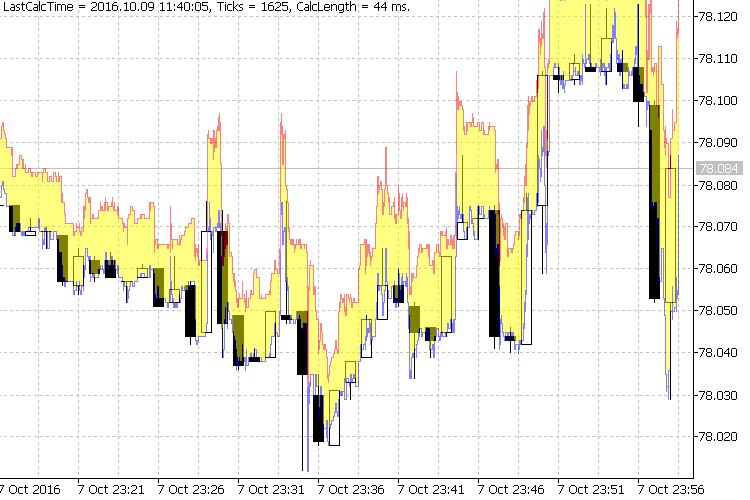
Differs from other tick indicators in that it shows the history on the main chart directly over the bars. The "spread" history is clearly visible, as well as formation process of each bar. Visually shows the formation of the current real-time bar.

Warning
As the indicator shows the price tick history for all time interval visible on the chart, the number of ticks for visualization may count up to hundreds of thousands and millions. Such heavy load causes the indicator to work slowly. For example, at the minimum scale on the H1, the visible interval may reach several months. The indicator will work very slowly, in order to load and display many millions of ticks.
If you are going to monitor ticks, it is logical to use a small TF (up to M5) and a large scale, in order to be able to see the price history in details (as in the figure above).
The indicator was taken from the blog and slightly modified — it had array overflows. Added (several lines) filling the area between the corresponding LowAsk and HighBid. Much of the excess was removed from the original — OOP construction of the indicator and unused mqh-files.
It is surprisingly (has no indicator buffers at all) stable.
Its design is far from optimal. Apparently, this is due to the fact that many bugs in the CopyTicks function had not been fixed yet at the time it was written. However, it shows the history data correctly and quite quickly (there is room for increasing the speed significantly).
Addressing this indicator via iCustom and IndicatorCreate is meaningless — there are no indicator buffers. It only serves for history visualization. And it is actually designed as an indicator only due to a certain coincidence of the main function — to show.
For example, the same as an EA
#property strict

#include <fxsaber\ChartObjects\ChartObjectTicks.mqh>

CHARTOBJECTTICKS ChartObject;

void OnChartEvent( const int id, const long& lparam, const double& dparam, const string& sparam )
{
  EVENTBASE::MyEvent(id, lparam, dparam, sparam);
}

void OnTick( void )
{
  if (::ChartGetInteger(0, ::CHART_FIRST_VISIBLE_BAR) <= ::ChartGetInteger(0, ::CHART_VISIBLE_BARS))
    ChartObject.Visual();
}
That is, it simply uses one of the custom types of interactive graphical objects. Therefore, paradoxically, this indicator is only formally an indicator — the technical form of MT program.
The transparency level for this object can be set in the input parameters.
The indicator is self-sufficient, it does not use standard libraries.
Making a screenshot using the terminal means is problematic — it may not match what the terminal shows.
Complies for MetaTrader 4, but of course, it does not show anything (no CopyTicks data).
MetaQuotes Ltd에서 러시아어로 번역함.
원본 코드: https://www.mql5.com/ru/code/16537
 ZigZag_OsMACandle
The ZigZag based on the OsMACandle oscillator.
 ZigZag_OsMA
The ZigZag based on the OsMA oscillator.
 TriggerLine with Arrow
The Trigger Line indicator with arrows.
 Tick Chart
The indicator displays the Ask and Bid, which are taken from the real tick history. Also, it is possible to evaluate the spread changes by visually comparing the Ask and Bid.