당사 팬 페이지에 가입하십시오
- 게시자:
- Dmitri Migunov
- 조회수:
- 41416
- 평가:
- 게시됨:
- 2016.10.10 17:26
- 업데이트됨:
- 2016.11.22 07:32
-
이 코드를 기반으로 한 로봇이나 지표가 필요하신가요? 프리랜스로 주문하세요 프리랜스로 이동
Authors:
Thanks for previous version of "Var Mov Avg3 " (2004) to authors GOODMAN & Mstera и AF. I (Dmitri Migunov) optimized, accelerated and improved the script. And also I added signal dots (yellow color by default) on chart.
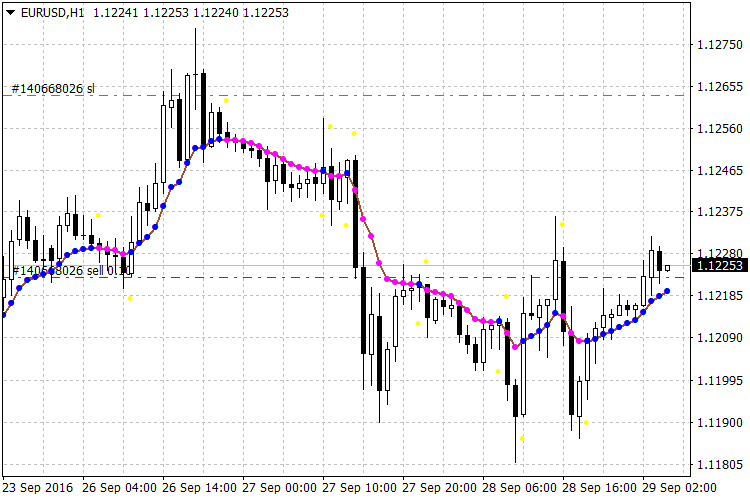
This indicator is based on the moving average, but it doesn't use any standard MT4/MT5 moving average indicators. It uses its own formula to calculate the moving average with a complex noise filter to produce more accurate signals. The indicator displays dotted line in the main chart window exactly over the price curve. The changing colors of the dots signal trend changes. The indicator shows signals on chart (yellow dots by default higher/below price), and also can signal sound alerts on trend changes; you can turn them on and off.
When the dots are pink, the price is in the downtrend. When the dots are blue, the price is in the uptrend. BUY when pink changes to blue and SELL when blue changes to pink. These moments are marked by yellow dots. If the yellow dot is above the price, this is a signal to SELL. If the yellow dot is below the price, this is a signal to BUY. Use moderate Stop Loss to protect yourself from false signals.
Updated in 20 oct, 2016: now you can change the maximum offset of the signal dots from current price. Change "offsetInPips" parameter for it.

 Stop & Limit Bots
Two EA's. One places Stop orders the other places Limit orders.
 Renko Chart from ticks (Most precise method)
Renko chart generator using the tick values.
 Awesome Oscillator - 4 colors, customizable
Awesome Oscillator, customizable, 4 colors (as seen on some AIMS YouTube videos), and some more parameters.
 Example of OnChartEvent() Function
This is a great beginners' example of the function OnChartEvent() & creating objects on the chart to access them for some tasks.