당사 팬 페이지에 가입하십시오
- 조회수:
- 14411
- 평가:
- 게시됨:
- 2017.01.18 09:15
-
이 코드를 기반으로 한 로봇이나 지표가 필요하신가요? 프리랜스로 주문하세요 프리랜스로 이동
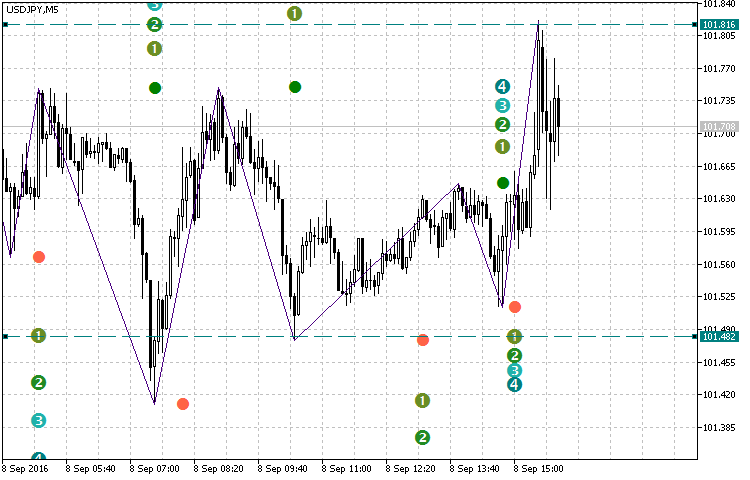
The Fibo ZigaZag indicator allows to calculate the probable support and resistance levels using the Fibonacci ratios.
The Indicator Algorithm
The indicator locates the subsequent Highs and Lows, finds the distance between them and lays off the percentages of this distance (23,6%, 38,2%, 50%, 61,8%) from peaks and bottoms. The calculation is performed when the minimum or maximum are completed. This indicator is a completely revised version of the standard ZigZag indicator.
Fields of application
The indicator can be used for setting the Stop Loss and Take Profit, partially fixing profit. The indicator may also be of interest to traders who use the Joe DiNapoli system.
The Fibonacci levels may become good entry points in averaging experts.
Levels
- 23.6%
- 38.2%
- 50%
- 61.8 %
Indicator Parameters
- ExtDepth — The number of candles used to identify High or Low The main parameter.
- ExtDeviation — Minimum deviation in points.
- InpBackstep — The number of extremums used for recalculation.

MetaQuotes Ltd에서 러시아어로 번역함.
원본 코드: https://www.mql5.com/ru/code/16319
 ColorXvaMA_Digit_StDev V2
The vaMA indicator with the ability to replace averaging. It displays the most recent value as a price label with the possibility to round the channel levels up to a required number of digits. Additionally, it indicates the trend strength by colored dots based on the standard deviation algorithm.
 i4_DRF_v3_HTF
The i4_DRF_v3 indicator with the timeframe selection option available in the input parameters.
 Fibo Bar MT5
Indicator that draws Fibonacci levels based on the last bar.
 Histogram Bid and Ask prices
The statistical distribution of Bid and Ask prices on the chart as a histogram.