당사 팬 페이지에 가입하십시오
- 조회수:
- 42879
- 평가:
- 게시됨:
- 2016.10.27 13:41
- 업데이트됨:
- 2016.11.22 07:32
-
이 코드를 기반으로 한 로봇이나 지표가 필요하신가요? 프리랜스로 주문하세요 프리랜스로 이동
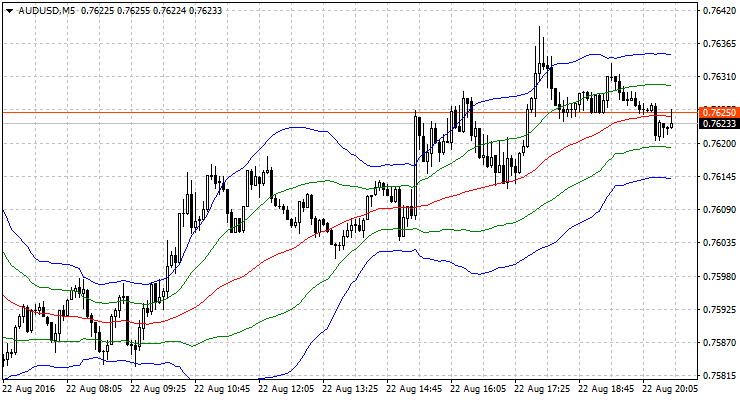
In essence, this is an advanced version of the Bollinger Bands
Specifically, in this indicator I have studied the movement of the price for a certain number of bars (BarsCount = 200). For this purpose, the MA with a period of 1 was used (MAPeriod). For that matter, any MA and any number of bars could have been used for analysis. As a result, two channels will be plotted. One displays the limits where the price ranges 68% of the time for the specified number of bars. The other shows the limits where the price ranges 95% of the time for the specified number of bars.
The Sigma Bands with the default parameters is almost identical to the Bollinger Bands with the same period, equal to BarsCount. But this version has the ability to plot Bollinger Bands not only with any period by changing the BarsCount,but also to plot is based on the selected MA type with any period.
Supported MA types:
- Simple MA
- Exponential MA
- Smoothed MA
- Linear-weighted MA
Prices that can be used for plotting the channel:
- Close price
- Open price
- The maximum price for the period (High)
- The minimum price for the period (Low)
- Median price (high + low)/2,
- Typical price (high + low + close)/3
- Weighted close price (high + low + close + close)/4
All these settings are not available for the standard Bollinger Bands.
By learning how to determine the limits where any indicator or price ranges most of the time, I eneded up with making an example of calculating the standard deviation and Sigma implemented as this indicator. Its formulas can now be adapted for any indicator you like. Sometimes, interesting results can be obtained for indicators that are plotted in separate windows, for example, the RSI, TVI or others.

Recommendations:
The difference between conventional Bollinger Bands and Sigma Bands can be seen only when using non-default settings and MAPeriod > 1.
Settings:
int MAPeriod = 1; // MA Period
int BarsCount = 200; // Bars for calculating the deviation (Sigma)
int TypeBandsMA = 0; // Type of MA for Bands
int TypePriceMA = 0; // Applied price of MA
color MAColor = clrNONE; // MA color
The analyzed MA is colorless by default. If you want to see it, set a color in the MAColor parameter.
MetaQuotes Ltd에서 러시아어로 번역함.
원본 코드: https://www.mql5.com/ru/code/16198
 Price_Compare
Elegant and nimble comparison of 'double' values of the "price".
 Indicator for monitoring the lot and profit
The indicator displays the total lot and profit for the current instrument.
 Multi Timeframe Moving Average
The indicator displays the moving average for the selected timeframe.
 PriceLines
Script for drawing a price markup.