당사 팬 페이지에 가입하십시오
- 조회수:
- 3710
- 평가:
- 게시됨:
- 2016.10.10 15:27
- 업데이트됨:
- 2016.11.22 07:32
-
이 코드를 기반으로 한 로봇이나 지표가 필요하신가요? 프리랜스로 주문하세요 프리랜스로 이동
Real author:
Alexander Piechotta
The i-CAi indicator with additional trend strength indication using colored dots based on the standard deviation algorithm.
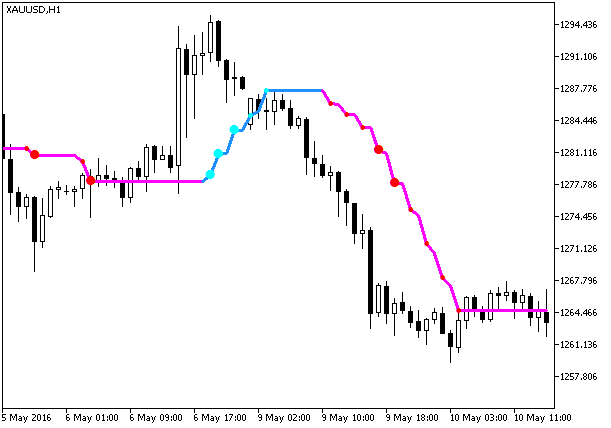
If the standard deviation of the i-CAi indicator is between the dK1 and dK2 parameter values, then a small colored dot appears on the moving average. Its color corresponds to the current trend direction.
input double dK1=1.5;  // Square-law filter coefficient 1
input double dK2=2.5;  // Square-law filter coefficient 2
If the standard deviation becomes higher than the dK2 input parameter value, then the dot size increases. Thus, we get 3 levels of trend strength indication.
- Weak — no dots;
- Medium — small colored dots;
- Strong — big colored dots.

Fig.1. The i-CAi_StDev indicator
MetaQuotes Ltd에서 러시아어로 번역함.
원본 코드: https://www.mql5.com/ru/code/15989
 SMI_Correct
Variation of the SMI indicator based on the "Momentum, Direction, and Divergence" book by Blau.
 ZZLevels
The ZZLevels indicator uses the Simple ZigZag to find the boundaries of the flat, as well as the support and resistance levels.
 yEffekt_HTF
The yEffekt indicator with the timeframe selection option available in input parameters.
 Simple ZZ Consolidation Zones
More experiments with the Simple ZigZag indicator. A small upgrade allows the indicator to find and mark the price consolidation areas with colored rectangles.