당사 팬 페이지에 가입하십시오
- 조회수:
- 8414
- 평가:
- 게시됨:
- 2016.04.14 11:14
- 업데이트됨:
- 2023.03.29 13:47
-
이 코드를 기반으로 한 로봇이나 지표가 필요하신가요? 프리랜스로 주문하세요 프리랜스로 이동
Real author:
Yuriy Tokman (YTG)
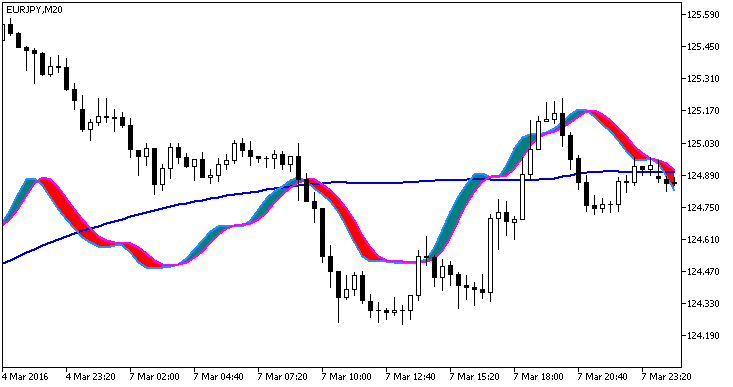
The RVI Oscillator in the main chart window relative to the Moving Average indicator. RVI is drawn as a colored cloud, the Moving Average is blue.
Indicator input parameters:
//+-------------------------------------------------+
//| Indicator input parameters                      |
//+-------------------------------------------------+
input uint RVIPeriod=14;
input Smooth_Method XMA_Method=MODE_SMMA;             // Averaging method
input uint XLength=12;                                // Depth of averaging
input int XPhase=15;                                  // Smoothing parameter
//---- for JJMA within the range of -100 ... +100 it influences the quality of the transition process;
//---- for VIDIA it is a CMO period, for AMA it is a slow average period
input double Dev=1000.0;                              // Indicator deviation
input ENUM_APPLIED_PRICE  Applied_price=PRICE_CLOSE;  // Price type or handle
input int Shift=0;                                    // Horizontal indicator shift in bars
The indicator uses SmoothAlgorithms.mqh library classes (copy it to <terminal_data_folder>\MQL5\Include). The use of the classes was thoroughly described in the article "Averaging Price Series for Intermediate Calculations Without Using Additional Buffers".

Fig.1. The RVI_Chart indicator
MetaQuotes Ltd에서 러시아어로 번역함.
원본 코드: https://www.mql5.com/ru/code/15114
 Stochastic_Chart
Stochastic Oscillator in the main chart window relative to the Moving Average indicator.
 MFI_Chart
The MFI oscillator in the main chart window relative to the Moving Average indicator.
 MQL 5 Wizard - Simpler Intraday Time Filter
Filter based on the Intraday time filter offered by the standard library.
 MQL5 Wizard - GANN HiLo Signal
Signal based on the indicator Gann Hilo.