당사 팬 페이지에 가입하십시오
- 조회수:
- 3577
- 평가:
- 게시됨:
- 2016.04.13 16:01
- 업데이트됨:
- 2016.11.22 07:32
-
이 코드를 기반으로 한 로봇이나 지표가 필요하신가요? 프리랜스로 주문하세요 프리랜스로 이동
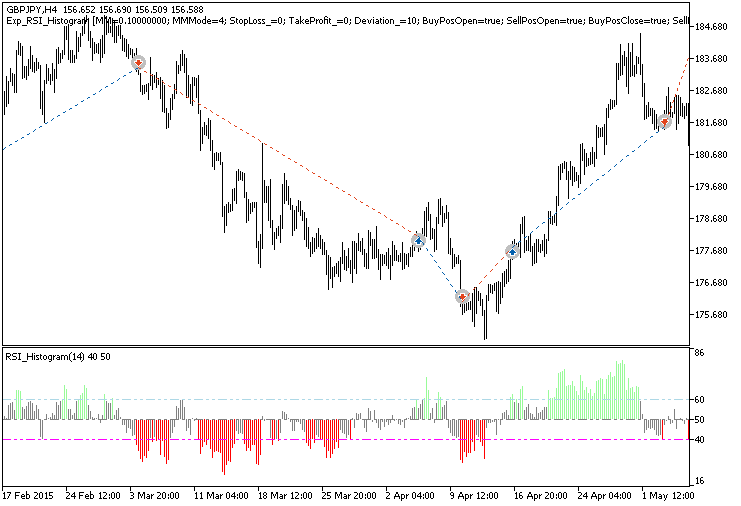
A trading system based on the signals of the RSI_Histogram indicator. A trade signal is generated at the close of a bar if the color of the histogram has changed from a neutral gray to red or lime, i.e. when the RSI oscillator has entered the overbought or oversold zone.
The Expert Advisor uses the compiled indicator file RSI_Histogram.ex5 for operation. Save it to <terminal_data_folder>\MQL5\Indicators.
Note that the TradeAlgorithms.mqh library file allows using Expert Advisors with the brokers who offer nonzero spread and the option of setting Stop Loss and Take Profit during position opening. You can download more variants of the library at the following link: Trade Algorithms.
Default Expert Advisor's input parameters have been used during tests shown below. Stop Loss and Take Profit have not been used during the tests.

Fig. 1. Examples of trades on the chart
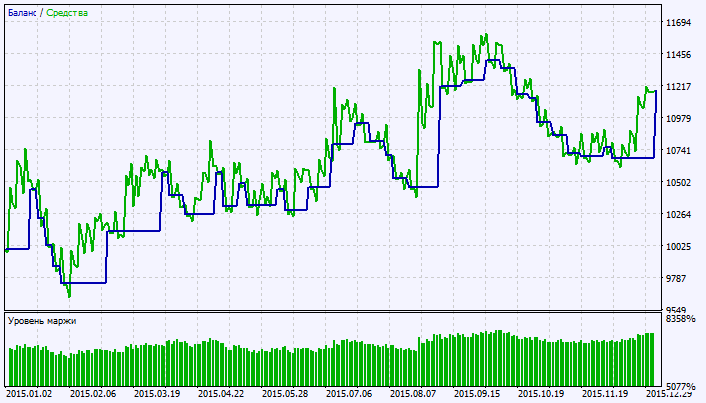
Testing results for 2015 on GBPJPY H4:
Fig. 2. Chart of testing results
MetaQuotes Ltd에서 러시아어로 번역함.
원본 코드: https://www.mql5.com/ru/code/14951
 Multicurrency Expert
A multi-currency (10 currency pairs) Expert Advisor that does not use indicators.
 RVI_Histogram
The classical RVI oscillator implemented as a histogram with a color indication of entering the overbought and oversold areas, as well as a colored cloud between the signal line and the oscillator to indicate the oscillator intersections.
 Exp_MFI_Histogram
A trading system based on the signals of the MFI_Histogram indicator.
 Exp_WPR_Histogram
A trading system based on the signals of the WPR_Histogram indicator.
