당사 팬 페이지에 가입하십시오
- 조회수:
- 32498
- 평가:
- 게시됨:
- 2016.03.01 15:50
- 업데이트됨:
- 2016.11.22 07:32
-
 이 코드를 기반으로 한 로봇이나 지표가 필요하신가요? 프리랜스로 주문하세요
프리랜스로 이동
이 코드를 기반으로 한 로봇이나 지표가 필요하신가요? 프리랜스로 주문하세요
프리랜스로 이동
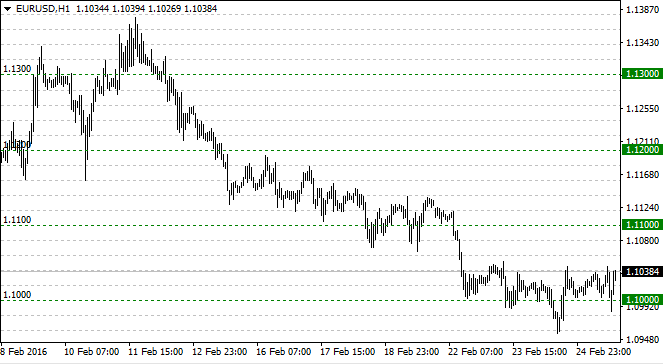
The indicator places a series of equidistant adaptive horizontal lines to a chart. The lines are updated with every chart change and are independent on symbol or scale. If the user changes the vertical scale, the indicator adds or removes lines accordingly.
The lines have two colours, the primary colour is dedicated to lines glued to round numbers, the weak colour is for secondary lines equidistantly placed between the round-number lines.
The user may swap their colours.
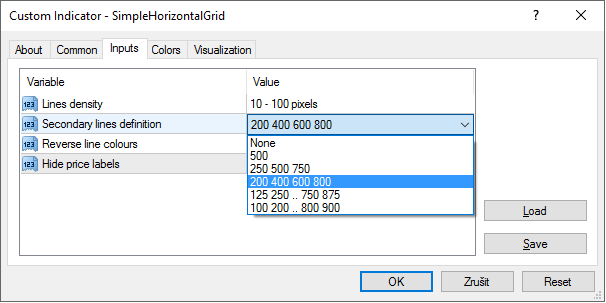
The indicator works out of box, but user may adjust a few parameters.
Additional input settings:
- density of lines (distance between lines)
- number of secondary lines between two primary lines
- switch off displaying the primary line labels on the scale
Recommendations:
The standard grid should be switched off (ctrl+G) when using this indicator
Switching the object descriptions on (F8 - Show Objects Description) makes visible line labels on left. They may be used as a substitute for the hidden scale labels.
 Signalitics Trend Assistant
View current and historical trends of every timeframe.
Kaufman's AMA from wellx
Non-optimized version of Kaufman's adaptive moving average.
Dynamic Candle Timer
The indicator shows: the remaining time on each candle, the changing value of the Bid price, tick by tick, the relative price position of the Bid/Ask spread.
Use MA to draw UpDown_Resistance
The indicator uses Move Average to draw the level line of up and down.